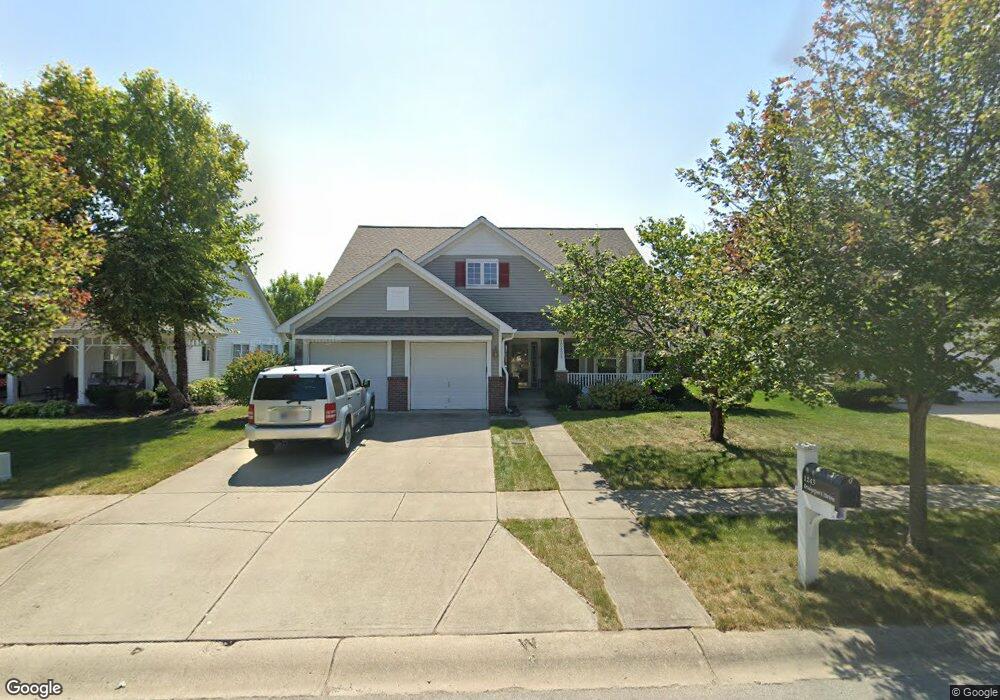
1243 Bridgeport Dr Westfield, IN 46074
Estimated Value: $386,324 - $443,000
3
Beds
2
Baths
2,018
Sq Ft
$205/Sq Ft
Est. Value
About This Home
This home is located at 1243 Bridgeport Dr, Westfield, IN 46074 and is currently estimated at $413,581, approximately $204 per square foot. 1243 Bridgeport Dr is a home located in Hamilton County with nearby schools including Maple Glen Elementary, Westfield Intermediate School, and Westfield Middle School.
Ownership History
Date
Name
Owned For
Owner Type
Purchase Details
Closed on
Dec 21, 2011
Sold by
Fourman Terrence L and Fourman Lydia A
Bought by
Hastings Carole
Current Estimated Value
Home Financials for this Owner
Home Financials are based on the most recent Mortgage that was taken out on this home.
Original Mortgage
$70,000
Outstanding Balance
$47,839
Interest Rate
3.99%
Mortgage Type
New Conventional
Estimated Equity
$365,742
Purchase Details
Closed on
Dec 17, 2002
Sold by
The Estridge Group Inc
Bought by
Fourman Terrence L and Fourman Lydia A
Home Financials for this Owner
Home Financials are based on the most recent Mortgage that was taken out on this home.
Original Mortgage
$168,900
Interest Rate
6.23%
Mortgage Type
Purchase Money Mortgage
Purchase Details
Closed on
Jul 31, 2002
Sold by
Cec Associates Llc
Bought by
The Estridge Group Inc
Create a Home Valuation Report for This Property
The Home Valuation Report is an in-depth analysis detailing your home's value as well as a comparison with similar homes in the area
Home Values in the Area
Average Home Value in this Area
Purchase History
| Date | Buyer | Sale Price | Title Company |
|---|---|---|---|
| Hastings Carole | -- | First American Title Ins Co | |
| Fourman Terrence L | -- | -- | |
| The Estridge Group Inc | -- | -- |
Source: Public Records
Mortgage History
| Date | Status | Borrower | Loan Amount |
|---|---|---|---|
| Open | Hastings Carole | $70,000 | |
| Previous Owner | Fourman Terrence L | $168,900 |
Source: Public Records
Tax History Compared to Growth
Tax History
| Year | Tax Paid | Tax Assessment Tax Assessment Total Assessment is a certain percentage of the fair market value that is determined by local assessors to be the total taxable value of land and additions on the property. | Land | Improvement |
|---|---|---|---|---|
| 2024 | $3,436 | $315,600 | $57,200 | $258,400 |
| 2023 | $3,501 | $304,000 | $57,200 | $246,800 |
| 2022 | $2,900 | $273,100 | $57,200 | $215,900 |
| 2021 | $2,900 | $240,800 | $57,200 | $183,600 |
| 2020 | $2,849 | $234,600 | $57,200 | $177,400 |
| 2019 | $2,665 | $219,700 | $33,100 | $186,600 |
| 2018 | $2,411 | $199,100 | $33,100 | $166,000 |
| 2017 | $2,179 | $192,800 | $33,100 | $159,700 |
| 2016 | $2,089 | $184,800 | $33,100 | $151,700 |
| 2014 | $1,873 | $169,400 | $33,100 | $136,300 |
| 2013 | $1,873 | $159,200 | $33,100 | $126,100 |
Source: Public Records
Map
Nearby Homes
- 1327 Annapolis Dr
- 15234 Nashua Cir
- 1019 Belvedere Place
- 1332 Mayfield Ct
- 1237 Wolcott Ct
- 15365 Holcombe Dr
- 15425 Smithfield Dr
- 809 Stockbridge Dr
- 1471 Avondale Dr
- 1588 Rossmay Dr
- 1661 Dewey Dr
- 1425 Birchfield Dr
- 15565 Starflower Dr
- 15440 Heatherbank Dr
- 660 Richland Way
- 1510 Birchfield Dr
- 15593 Marsden Dr
- 15564 Bethesda Cir
- 14565 Bedford Falls Dr
- 1636 Birchfield Dr
- 1259 Bridgeport Dr
- 1229 Bridgeport Dr
- 1246 Monmouth Dr
- 1215 Bridgeport Dr
- 1273 Bridgeport Dr
- 1238 Monmouth Dr
- 1260 Monmouth Dr
- 1252 Bridgeport Dr
- 1285 Bridgeport Dr
- 1203 Bridgeport Dr
- 1234 Bridgeport Dr
- 1230 Monmouth Dr
- 1266 Bridgeport Dr
- 1222 Bridgeport Dr
- 1306 Monmouth Dr
- 1299 Bridgeport Dr
- 1187 Bridgeport Dr
- 1278 Bridgeport Dr
- 1198 Bridgeport Dr
- 15041 Montclair Dr