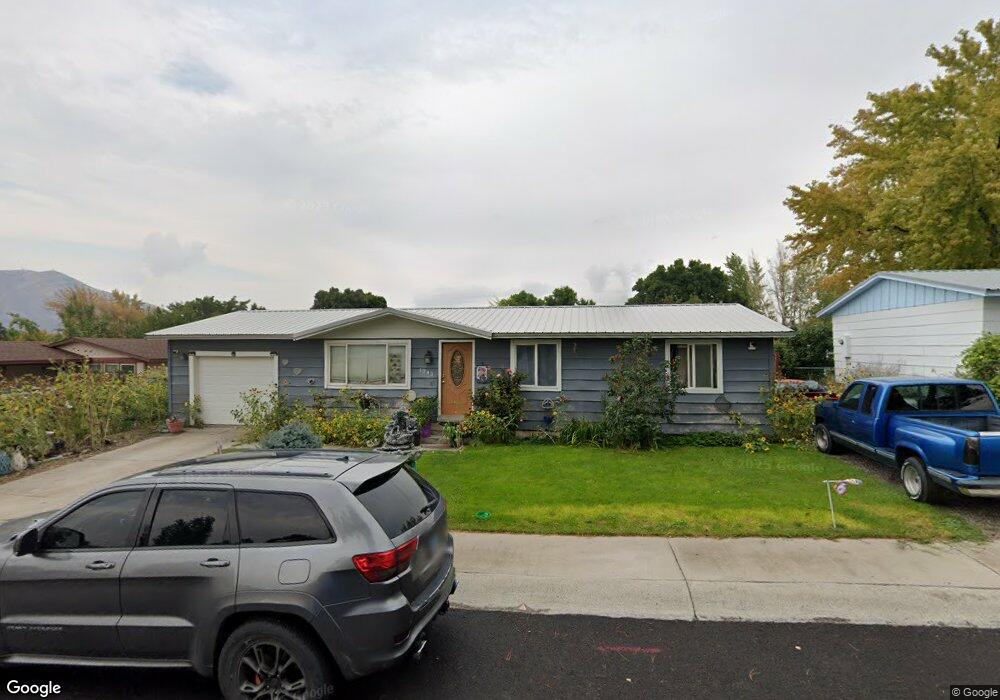
1243 Cosgrave Ave Winnemucca, NV 89445
Estimated Value: $282,811 - $301,000
--
Bed
1
Bath
1,008
Sq Ft
$287/Sq Ft
Est. Value
About This Home
This home is located at 1243 Cosgrave Ave, Winnemucca, NV 89445 and is currently estimated at $288,953, approximately $286 per square foot. 1243 Cosgrave Ave is a home located in Humboldt County with nearby schools including Sonoma Heights Elementary School, Winnemucca Junior High School, and French Ford Middle School.
Ownership History
Date
Name
Owned For
Owner Type
Purchase Details
Closed on
Dec 11, 2019
Sold by
Grysen Taylor M
Bought by
Michel Cervantes Jasson Michel
Current Estimated Value
Home Financials for this Owner
Home Financials are based on the most recent Mortgage that was taken out on this home.
Original Mortgage
$151,946
Outstanding Balance
$133,938
Interest Rate
3.7%
Mortgage Type
FHA
Estimated Equity
$155,015
Purchase Details
Closed on
Nov 9, 2017
Sold by
Jepesem Mkickey L and Jepesem Elizanert
Bought by
Crysen Taylor M
Home Financials for this Owner
Home Financials are based on the most recent Mortgage that was taken out on this home.
Original Mortgage
$128,686
Interest Rate
3.94%
Mortgage Type
New Conventional
Purchase Details
Closed on
Aug 22, 2008
Sold by
Jeppsen Mickey L
Bought by
Jeppsen Mickey L and Jeppsen Elizabeth A
Purchase Details
Closed on
Sep 14, 2007
Sold by
Humboldt County Clerk
Bought by
Jeppsen Mickey L
Create a Home Valuation Report for This Property
The Home Valuation Report is an in-depth analysis detailing your home's value as well as a comparison with similar homes in the area
Home Values in the Area
Average Home Value in this Area
Purchase History
| Date | Buyer | Sale Price | Title Company |
|---|---|---|---|
| Michel Cervantes Jasson Michel | $154,750 | Western Title Company | |
| Crysen Taylor M | $127,400 | Stewart Title Elko | |
| Jeppsen Mickey L | -- | None Available | |
| Jeppsen Mickey L | -- | None Available |
Source: Public Records
Mortgage History
| Date | Status | Borrower | Loan Amount |
|---|---|---|---|
| Open | Michel Cervantes Jasson Michel | $151,946 | |
| Previous Owner | Crysen Taylor M | $128,686 |
Source: Public Records
Tax History Compared to Growth
Tax History
| Year | Tax Paid | Tax Assessment Tax Assessment Total Assessment is a certain percentage of the fair market value that is determined by local assessors to be the total taxable value of land and additions on the property. | Land | Improvement |
|---|---|---|---|---|
| 2025 | $966 | $26,628 | $9,800 | $16,828 |
| 2024 | $919 | $27,103 | $9,800 | $17,303 |
| 2023 | $919 | $24,121 | $7,525 | $16,596 |
| 2022 | $804 | $21,930 | $7,525 | $14,405 |
| 2021 | $810 | $22,133 | $7,525 | $14,608 |
| 2020 | $828 | $22,701 | $7,525 | $15,176 |
| 2019 | $818 | $22,384 | $7,525 | $14,859 |
| 2018 | $815 | $22,279 | $7,525 | $14,754 |
| 2017 | $822 | $22,505 | $7,525 | $14,980 |
| 2016 | $840 | $23,516 | $7,525 | $15,991 |
| 2015 | $839 | $23,560 | $7,525 | $16,035 |
| 2014 | $839 | $23,464 | $7,525 | $15,939 |
Source: Public Records
Map
Nearby Homes
- 3 Colado Ct
- 502 Prebble St
- 702 W Mcarthur Ave Unit 56
- 702 W Mcarthur Ave Unit 82
- 121 W Shepard St
- 134 W Shepard St
- 1385 S Bridge St
- 240 Circle Dr
- 16-0541-03 Walther Ln
- 4180 Turner Ln
- 273 Mccoy St
- 609 Sheehan St
- 0 Julie Ct
- 540 Aiken St
- 20 Julie Ct
- 5270 Marla Dr Unit 14
- 45 Julie Ct
- 539 S Bridge St
- 406 W 5th St
- 253 N Highland Dr
- 1243 Cosgrave St
- 1257 Cosgrave Ave
- 1239 Cosgrave Ave
- 1266 Toy Ave
- 1288 Toy St
- 1288 Toy Ave
- 1254 Toy Ave
- 1297 Cosgrave Ave
- 1298 Toy Ave
- 1227 Cosgrave Ave
- 1353 Pronto Ave
- 1242 Toy Ave
- 1228 Cosgrave Ave
- 1228 Cosgrave Ave
- 1215 Cosgrave Ave
- 669 Argenta Ave
- 1212 Toy Ave
- 1287 Toy Avew
- 1337 Pronto Ave
- 1269 Toy Ave