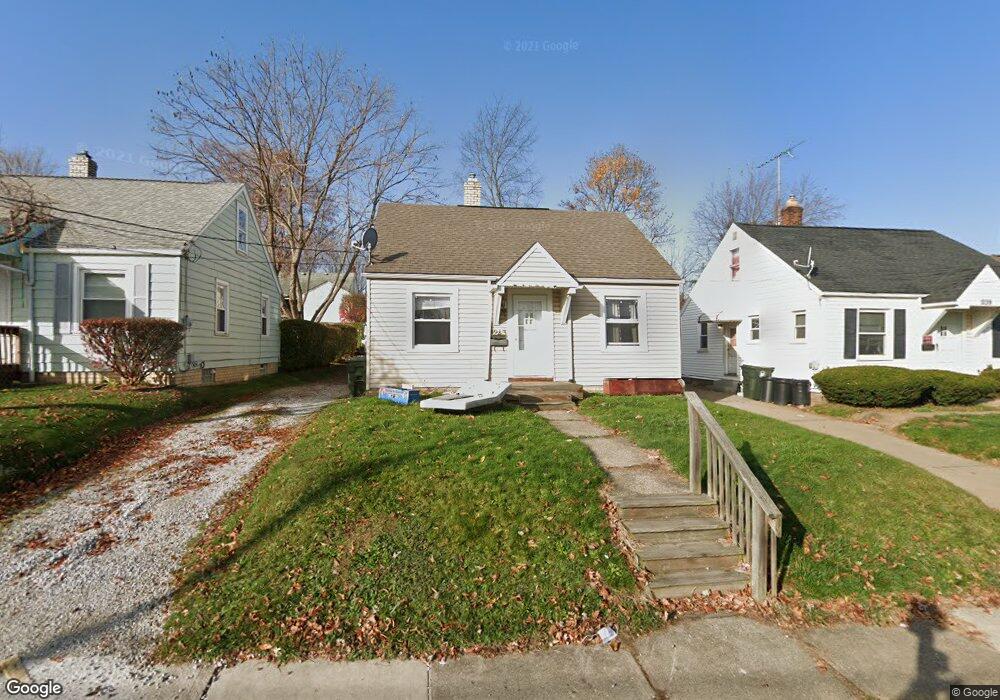
1243 Dartmouth Ave SW Canton, OH 44710
Souers NeighborhoodEstimated Value: $97,678 - $116,000
3
Beds
1
Bath
1,014
Sq Ft
$102/Sq Ft
Est. Value
About This Home
This home is located at 1243 Dartmouth Ave SW, Canton, OH 44710 and is currently estimated at $103,920, approximately $102 per square foot. 1243 Dartmouth Ave SW is a home located in Stark County with nearby schools including Early Learning Center @ Schreiber, Cedar Elementary School, and McGregor Elementary School.
Ownership History
Date
Name
Owned For
Owner Type
Purchase Details
Closed on
Jan 10, 2024
Sold by
Nolan Jennifer F
Bought by
Burleson Joshua James
Current Estimated Value
Purchase Details
Closed on
Feb 1, 2023
Sold by
Burleson Properties Llc
Bought by
Nolan Jennifer F
Purchase Details
Closed on
Mar 9, 2012
Sold by
Burleson Dennis J
Bought by
Burleson Properties Llc
Purchase Details
Closed on
Jan 4, 2012
Sold by
Skico Group Llc
Bought by
Burleson Dennis J
Purchase Details
Closed on
Dec 31, 2009
Sold by
Us Bank National Association
Bought by
Skico Group Llc
Purchase Details
Closed on
Sep 24, 2009
Sold by
Nau Brian D
Bought by
Us Bank National Association
Purchase Details
Closed on
Dec 1, 2005
Sold by
Frascone Jean
Bought by
Nau Brian D
Create a Home Valuation Report for This Property
The Home Valuation Report is an in-depth analysis detailing your home's value as well as a comparison with similar homes in the area
Home Values in the Area
Average Home Value in this Area
Purchase History
| Date | Buyer | Sale Price | Title Company |
|---|---|---|---|
| Burleson Joshua James | -- | None Listed On Document | |
| Nolan Jennifer F | -- | None Listed On Document | |
| Burleson Properties Llc | -- | Attorney | |
| Burleson Dennis J | $42,000 | Attorney | |
| Skico Group Llc | $17,000 | Attorney | |
| Us Bank National Association | $20,000 | None Available | |
| Nau Brian D | $30,000 | -- |
Source: Public Records
Tax History Compared to Growth
Tax History
| Year | Tax Paid | Tax Assessment Tax Assessment Total Assessment is a certain percentage of the fair market value that is determined by local assessors to be the total taxable value of land and additions on the property. | Land | Improvement |
|---|---|---|---|---|
| 2025 | -- | $25,900 | $4,620 | $21,280 |
| 2024 | -- | $25,900 | $4,620 | $21,280 |
| 2023 | $1,132 | $18,550 | $4,200 | $14,350 |
| 2022 | $1,103 | $18,550 | $4,200 | $14,350 |
| 2021 | $1,114 | $18,550 | $4,200 | $14,350 |
| 2020 | $980 | $14,600 | $3,500 | $11,100 |
| 2019 | $859 | $14,600 | $3,500 | $11,100 |
| 2018 | $864 | $14,600 | $3,500 | $11,100 |
| 2017 | $917 | $14,110 | $3,400 | $10,710 |
| 2016 | $920 | $14,110 | $3,400 | $10,710 |
| 2015 | $926 | $14,110 | $3,400 | $10,710 |
| 2014 | $1,034 | $14,810 | $3,570 | $11,240 |
| 2013 | $499 | $14,810 | $3,570 | $11,240 |
Source: Public Records
Map
Nearby Homes
- 1019 Dartmouth Ave SW
- 2711 Blair Place SW
- 1023 Wertz Ave SW
- 929 Wertz Ave SW
- 3118 13th St SW
- 1238 Arlington Ave SW
- 921 Clarendon Ave SW
- 1013 Maryland Ave SW
- 1009 Arlington Ave SW
- 2416 9th St SW
- 846 Maryland Ave SW
- 931 Smith Ave SW
- 1361 Crescent Rd SW
- 2911 7th St SW
- 3029 7th St SW
- 1227 Greenfield Ave SW
- 3204 14th St SW
- 2310 7th St SW
- 3006 6th St SW
- 1547 Alden Ave SW
- 1239 Dartmouth Ave SW
- 1247 Dartmouth Ave SW
- 1231 Dartmouth Ave SW
- 1251 Dartmouth Ave SW
- 1240 Homewood Ave SW
- 1236 Homewood Ave SW
- 1244 Homewood Ave SW
- 1227 Dartmouth Ave SW
- 1248 Homewood Ave SW
- 1232 Homewood Ave SW
- 1248 Dartmouth Ave SW
- 1242 Dartmouth Ave SW
- 1238 Dartmouth Ave SW
- 1228 Homewood Ave SW
- 2703 13th St SW
- 2703 -2705 13th St SW
- 1223 Dartmouth Ave SW
- 1234 Dartmouth Ave SW
- 1252 Dartmouth Ave SW
- 1230 Dartmouth Ave SW