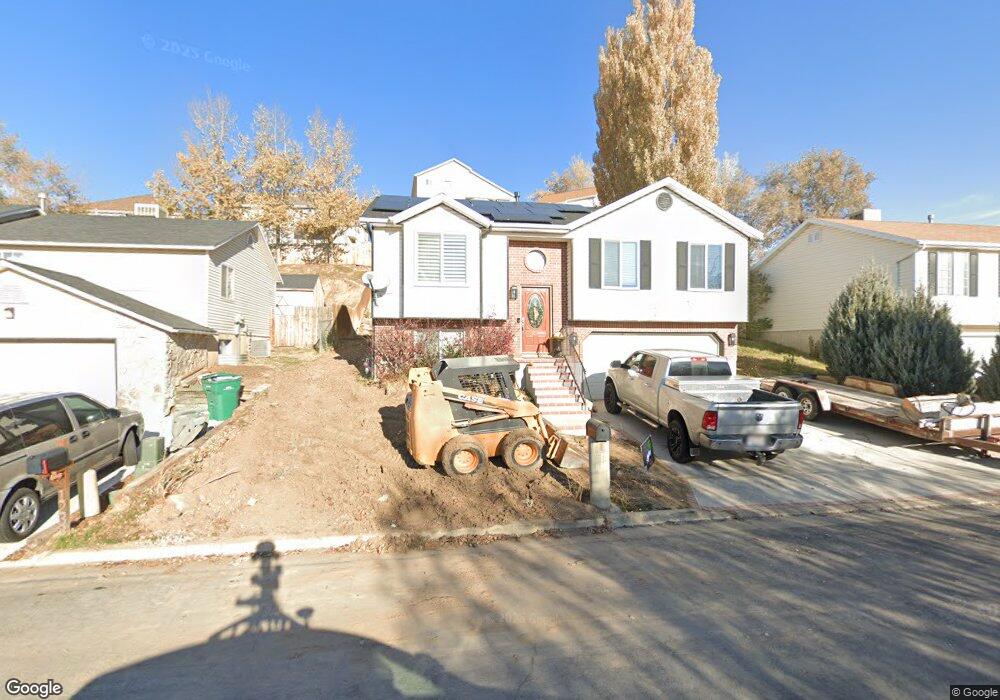
1243 E 3150 N Layton, UT 84040
Estimated Value: $429,108 - $446,000
3
Beds
2
Baths
1,071
Sq Ft
$407/Sq Ft
Est. Value
About This Home
This home is located at 1243 E 3150 N, Layton, UT 84040 and is currently estimated at $435,527, approximately $406 per square foot. 1243 E 3150 N is a home located in Davis County with nearby schools including Mountain View Elementary School, North Layton Junior High School, and Northridge High School.
Ownership History
Date
Name
Owned For
Owner Type
Purchase Details
Closed on
Jun 12, 2021
Sold by
Jensen Matthew S and Jensen Eric A
Bought by
Jensen Eric A
Current Estimated Value
Home Financials for this Owner
Home Financials are based on the most recent Mortgage that was taken out on this home.
Original Mortgage
$185,000
Outstanding Balance
$166,591
Interest Rate
2.7%
Mortgage Type
New Conventional
Estimated Equity
$268,936
Purchase Details
Closed on
Sep 20, 2011
Sold by
Jensen Eric A
Bought by
Jensen Matthew S and Jensen Eric A
Purchase Details
Closed on
Oct 30, 2008
Sold by
Jensen Matthew S
Bought by
Jensen Eric A
Purchase Details
Closed on
Nov 10, 2003
Sold by
Love Brigham J
Bought by
Jensen Matthew S
Home Financials for this Owner
Home Financials are based on the most recent Mortgage that was taken out on this home.
Original Mortgage
$97,600
Interest Rate
5.99%
Mortgage Type
Purchase Money Mortgage
Create a Home Valuation Report for This Property
The Home Valuation Report is an in-depth analysis detailing your home's value as well as a comparison with similar homes in the area
Home Values in the Area
Average Home Value in this Area
Purchase History
| Date | Buyer | Sale Price | Title Company |
|---|---|---|---|
| Jensen Eric A | -- | Amrock Inc | |
| Jensen Eric A | -- | Amrock Inc | |
| Jensen Matthew S | -- | Bonneville Superior | |
| Jensen Eric A | -- | Accommodation | |
| Jensen Matthew S | -- | Bonneville Title Company Inc |
Source: Public Records
Mortgage History
| Date | Status | Borrower | Loan Amount |
|---|---|---|---|
| Open | Jensen Eric A | $185,000 | |
| Closed | Jensen Eric A | $257,079 | |
| Previous Owner | Jensen Matthew S | $97,600 | |
| Closed | Jensen Matthew S | $24,400 |
Source: Public Records
Tax History
| Year | Tax Paid | Tax Assessment Tax Assessment Total Assessment is a certain percentage of the fair market value that is determined by local assessors to be the total taxable value of land and additions on the property. | Land | Improvement |
|---|---|---|---|---|
| 2025 | $2,075 | $217,800 | $101,836 | $115,964 |
| 2024 | $1,982 | $209,550 | $75,132 | $134,418 |
| 2023 | $1,964 | $366,000 | $131,791 | $234,209 |
| 2022 | $2,043 | $206,800 | $69,514 | $137,286 |
| 2021 | $1,888 | $285,000 | $113,278 | $171,722 |
| 2020 | $1,650 | $239,000 | $86,009 | $152,991 |
| 2019 | $1,643 | $233,000 | $70,010 | $162,990 |
| 2018 | $1,468 | $209,000 | $66,047 | $142,953 |
| 2016 | $1,323 | $97,185 | $31,710 | $65,475 |
| 2015 | $1,275 | $88,880 | $31,710 | $57,170 |
| 2014 | $1,179 | $84,049 | $31,710 | $52,339 |
| 2013 | -- | $77,572 | $28,952 | $48,620 |
Source: Public Records
Map
Nearby Homes
- 1266 E 3125 N
- 1241 E 3075 N
- 1321 E 3125 N
- 3176 N 1450 E
- 935 E 3000 N Unit 183
- 935 E 3000 N Unit 175
- 935 E 3000 N Unit 165
- 935 E 3000 N Unit 26
- 935 E 3000 N Unit 90
- 935 E 3000 N Unit 27
- 935 E Highway 193 Unit 102
- 935 E 3000 N Unit 56
- 3240 N Fairfield Rd Unit 6
- 3306 N Fairfield Rd
- 948 E Hercules Ct Unit 179
- 1447 E 2700 N
- 2826 N 1600 E
- 1731 E 2825 N
- 1827 E Whitetail Dr
- 1821 E Whitetail Way
Your Personal Tour Guide
Ask me questions while you tour the home.