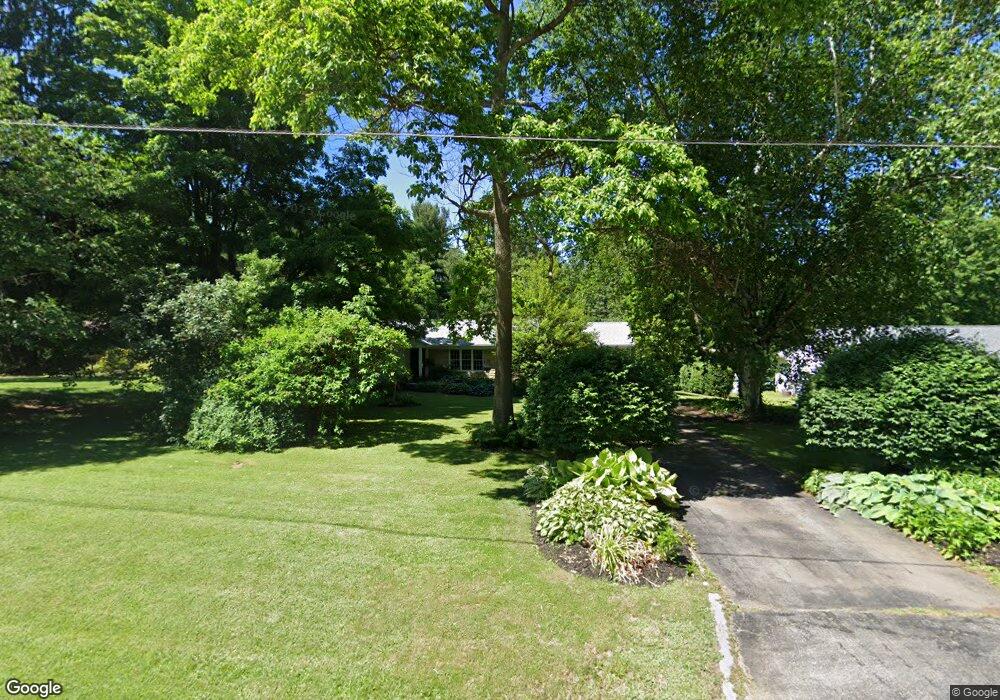
1243 High View Dr Wadsworth, OH 44281
Estimated Value: $213,480 - $305,000
2
Beds
6
Baths
1,288
Sq Ft
$212/Sq Ft
Est. Value
About This Home
This home is located at 1243 High View Dr, Wadsworth, OH 44281 and is currently estimated at $272,870, approximately $211 per square foot. 1243 High View Dr is a home located in Medina County with nearby schools including Highland Middle School, Highland High School, and Northside Christian Academy.
Ownership History
Date
Name
Owned For
Owner Type
Purchase Details
Closed on
Dec 20, 2014
Sold by
Carr Tyler C
Bought by
Carr Mary Elizabeth
Current Estimated Value
Purchase Details
Closed on
Mar 14, 2013
Sold by
Carr Brandon J
Bought by
Carr Mary Elizabeth
Purchase Details
Closed on
Jan 25, 2003
Sold by
Carr Mary Elizabeth and Carr Tyler C
Bought by
Carr Mary Elizabeth and Carr Tyler C
Purchase Details
Closed on
Mar 25, 2000
Sold by
Carr Brandon J
Bought by
Carr Mary Elizabeth and Carr Tyler C
Home Financials for this Owner
Home Financials are based on the most recent Mortgage that was taken out on this home.
Original Mortgage
$45,000
Outstanding Balance
$15,251
Interest Rate
8.29%
Estimated Equity
$257,619
Purchase Details
Closed on
Sep 30, 1999
Sold by
Estate Of Frank Zaleha
Bought by
Carr Mary Elizabeth and Carr Brandon J
Create a Home Valuation Report for This Property
The Home Valuation Report is an in-depth analysis detailing your home's value as well as a comparison with similar homes in the area
Home Values in the Area
Average Home Value in this Area
Purchase History
| Date | Buyer | Sale Price | Title Company |
|---|---|---|---|
| Carr Mary Elizabeth | -- | None Available | |
| Carr Mary Elizabeth | -- | None Available | |
| Carr Mary Elizabeth | -- | First Security Title Corpora | |
| Carr Mary Elizabeth | -- | Trident Title Agency | |
| Carr Mary Elizabeth | -- | -- |
Source: Public Records
Mortgage History
| Date | Status | Borrower | Loan Amount |
|---|---|---|---|
| Open | Carr Mary Elizabeth | $45,000 |
Source: Public Records
Tax History Compared to Growth
Tax History
| Year | Tax Paid | Tax Assessment Tax Assessment Total Assessment is a certain percentage of the fair market value that is determined by local assessors to be the total taxable value of land and additions on the property. | Land | Improvement |
|---|---|---|---|---|
| 2024 | $1,698 | $52,930 | $27,070 | $25,860 |
| 2023 | $1,698 | $52,930 | $27,070 | $25,860 |
| 2022 | $1,757 | $52,930 | $27,070 | $25,860 |
| 2021 | $2,021 | $44,480 | $22,750 | $21,730 |
| 2020 | $2,101 | $44,480 | $22,750 | $21,730 |
| 2019 | $2,572 | $44,480 | $22,750 | $21,730 |
| 2018 | $2,234 | $45,260 | $21,700 | $23,560 |
| 2017 | $2,491 | $45,260 | $21,700 | $23,560 |
| 2016 | $2,678 | $45,260 | $21,700 | $23,560 |
| 2015 | $2,607 | $42,710 | $20,480 | $22,230 |
| 2014 | $2,590 | $42,710 | $20,480 | $22,230 |
| 2013 | $2,588 | $42,710 | $20,480 | $22,230 |
Source: Public Records
Map
Nearby Homes
- 7186 Ridge Rd
- 1151 Fixler Rd
- 1166 Reserve Blvd
- 1199 Reserve Blvd
- 7544 State Rd
- 1796 Cobham Ln
- 4896 Ridge Rd
- Riverton Plan at Highlands of Sharon
- Hilltop Plan at Highlands of Sharon
- Greenfield Plan at Highlands of Sharon
- Westchester Plan at Highlands of Sharon
- Amberwood Plan at Highlands of Sharon
- 1396 Tullamore Trail
- 1414 Tullamore Trail
- 1384 Tullamore Trail
- 1400 Harmony Dr
- 354 Edenmore St
- 1031 Ledgestone Dr
- 525 Rockglen Dr
- 563 Rockglen Dr
- 1253 High View Dr
- 1223 High View Dr
- 1265 High View Dr
- 1213 High View Dr
- 1275 High View Dr
- 1234 High View Dr
- 1256 High View Dr
- 1216 High View Dr
- 1228 High View Dr
- 1203 High View Dr
- 1266 High View Dr
- 1287 High View Dr
- 1276 High View Dr
- 1194 High View Dr
- 1197 High View Dr
- 1210 High View Dr
- 1192 High View Dr
- 7251 Ridge Rd
- 7263 Ridge Rd
- 1184 High View Dr