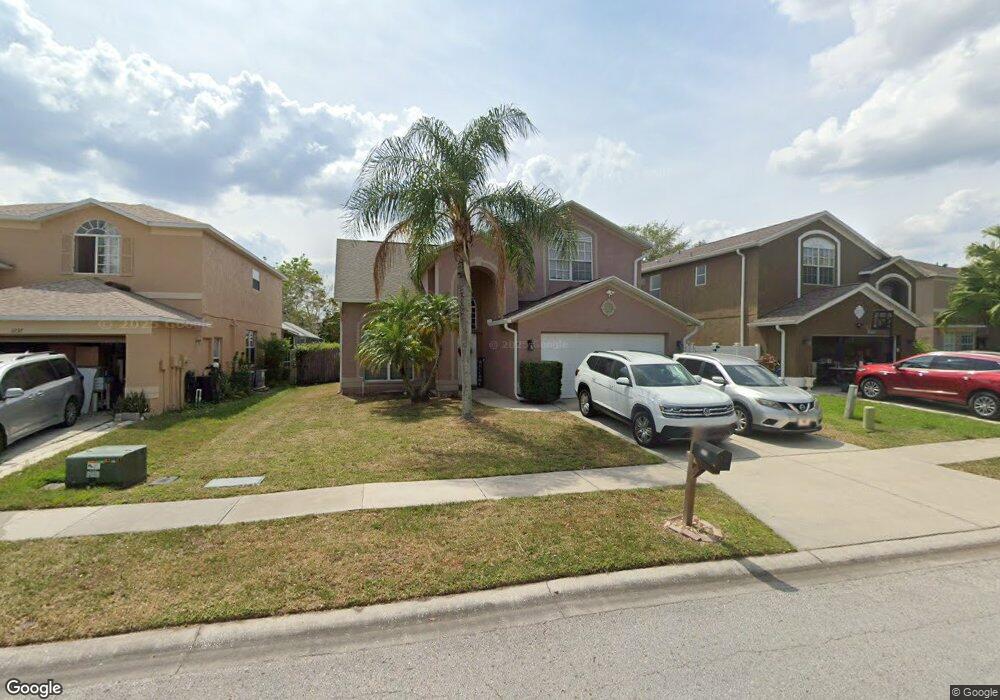
1243 Key West Ct Wesley Chapel, FL 33544
Northwood NeighborhoodEstimated Value: $465,000 - $476,000
--
Bed
3
Baths
1,987
Sq Ft
$238/Sq Ft
Est. Value
About This Home
This home is located at 1243 Key West Ct, Wesley Chapel, FL 33544 and is currently estimated at $472,332, approximately $237 per square foot. 1243 Key West Ct is a home located in Pasco County with nearby schools including Denham Oaks Elementary School, Dr. John Long Middle School, and Wiregrass Ranch High School.
Ownership History
Date
Name
Owned For
Owner Type
Purchase Details
Closed on
Jun 24, 2016
Sold by
Pope Shenouda Investment Llc
Bought by
Baker Timothy J
Current Estimated Value
Home Financials for this Owner
Home Financials are based on the most recent Mortgage that was taken out on this home.
Original Mortgage
$215,500
Outstanding Balance
$171,570
Interest Rate
3.58%
Mortgage Type
VA
Estimated Equity
$300,762
Purchase Details
Closed on
Dec 3, 2015
Sold by
Schisler Thomas and Schisler Karen L
Bought by
Pope Shenouda Investment Llc
Purchase Details
Closed on
Dec 1, 1997
Sold by
Us Home Corporation
Bought by
Schisler Thomas and Schisler Karen L
Home Financials for this Owner
Home Financials are based on the most recent Mortgage that was taken out on this home.
Original Mortgage
$135,900
Interest Rate
7.35%
Mortgage Type
New Conventional
Create a Home Valuation Report for This Property
The Home Valuation Report is an in-depth analysis detailing your home's value as well as a comparison with similar homes in the area
Home Values in the Area
Average Home Value in this Area
Purchase History
| Date | Buyer | Sale Price | Title Company |
|---|---|---|---|
| Baker Timothy J | $230,000 | Albritton Title Inc | |
| Pope Shenouda Investment Llc | $133,700 | None Available | |
| Schisler Thomas | $143,100 | -- |
Source: Public Records
Mortgage History
| Date | Status | Borrower | Loan Amount |
|---|---|---|---|
| Open | Baker Timothy J | $215,500 | |
| Previous Owner | Schisler Thomas | $128,800 | |
| Previous Owner | Schisler Thomas | $135,900 |
Source: Public Records
Tax History Compared to Growth
Tax History
| Year | Tax Paid | Tax Assessment Tax Assessment Total Assessment is a certain percentage of the fair market value that is determined by local assessors to be the total taxable value of land and additions on the property. | Land | Improvement |
|---|---|---|---|---|
| 2025 | $1,453 | $352,179 | $63,581 | $288,598 |
| 2024 | $1,453 | $359,741 | $63,581 | $296,160 |
| 2023 | $6,460 | $257,310 | $0 | $0 |
| 2022 | $5,283 | $283,730 | $46,256 | $237,474 |
| 2021 | $4,621 | $212,662 | $41,505 | $171,157 |
| 2020 | $4,507 | $205,744 | $41,505 | $164,239 |
| 2019 | $4,367 | $195,277 | $41,505 | $153,772 |
| 2018 | $4,269 | $188,928 | $41,505 | $147,423 |
| 2017 | $4,080 | $173,854 | $41,505 | $132,349 |
| 2016 | $4,442 | $169,070 | $41,505 | $127,565 |
| 2015 | $3,996 | $162,655 | $41,505 | $121,150 |
| 2014 | $2,844 | $157,071 | $41,505 | $115,566 |
Source: Public Records
Map
Nearby Homes
- 1243 Key Ct W
- 1247 Ocean Reef Rd Unit 2B
- 1311 Salt Clay Ct
- 27330 Coral Springs Dr
- 27133 Sea Breeze Way Unit 1
- 27109 Coral Springs Dr
- 27045 Sea Breeze Way
- 27141 La Jolla Way
- 27149 La Jolla Way
- 27129 La Jolla Way
- 27012 Sea Breeze Way
- 27653 Mulholland Ct
- 26953 Coral Springs Dr Unit 5
- 26943 Coral Springs Dr
- 27094 Carolina Aster Dr
- 26972 Evergreen Chase Dr
- 20461 Berrywood Ln
- 20484 Needletree Dr
- 8514 Brushleaf Way
- 20451 Berrywood Ln
- 1237 Key West Ct
- 1247 Key West Ct
- 1247 Key Ct W
- 1233 Key West Ct
- 1251 Key West Ct
- 1242 Key West Ct
- 1251 Key Ct W
- 1246 W Key Ct
- 1246 Key Ct W
- 1232 Key Ct W
- 1242 Salt Clay Ct
- 1305 Key West Ct
- 1250 Key Ct W
- 27347 Breakers Dr
- 1246 Key West Ct
- 1238 Salt Clay Ct
- 1236 Key West Ct
- 27411 Breakers Dr
- 1305 Key Ct W
- 27341 Breakers Dr