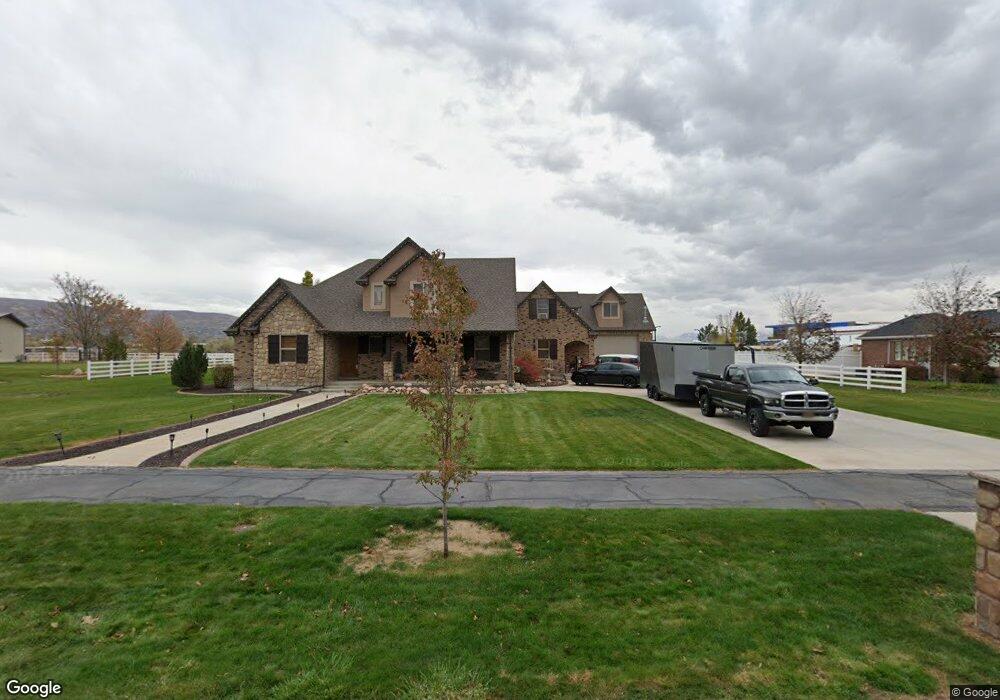
1243 Millbridge Ln West Bountiful, UT 84087
Estimated Value: $1,476,837 - $1,958,000
5
Beds
4
Baths
6,500
Sq Ft
$253/Sq Ft
Est. Value
About This Home
This home is located at 1243 Millbridge Ln, West Bountiful, UT 84087 and is currently estimated at $1,641,279, approximately $252 per square foot. 1243 Millbridge Ln is a home located in Davis County with nearby schools including West Bountiful Elementary School, Bountiful Junior High School, and Viewmont High School.
Ownership History
Date
Name
Owned For
Owner Type
Purchase Details
Closed on
Jul 30, 2024
Sold by
Buchanan Kimberli A
Bought by
Kim Buchanan Family Trust and Buchanan
Current Estimated Value
Purchase Details
Closed on
Dec 5, 2023
Sold by
Buchanan Bryce John
Bought by
Buchanan Kimberli A
Purchase Details
Closed on
Aug 23, 2005
Sold by
Richins Frank
Bought by
Buchanan Bryce J
Home Financials for this Owner
Home Financials are based on the most recent Mortgage that was taken out on this home.
Original Mortgage
$604,800
Interest Rate
5.25%
Mortgage Type
Fannie Mae Freddie Mac
Purchase Details
Closed on
Mar 7, 2003
Sold by
Mason Denise W
Bought by
Richins Frank
Home Financials for this Owner
Home Financials are based on the most recent Mortgage that was taken out on this home.
Original Mortgage
$376,446
Interest Rate
5.83%
Purchase Details
Closed on
Aug 15, 2001
Sold by
George Marvin L
Bought by
Mason Denise W and The Denise W Mason Trust
Create a Home Valuation Report for This Property
The Home Valuation Report is an in-depth analysis detailing your home's value as well as a comparison with similar homes in the area
Home Values in the Area
Average Home Value in this Area
Purchase History
| Date | Buyer | Sale Price | Title Company |
|---|---|---|---|
| Kim Buchanan Family Trust | -- | None Listed On Document | |
| Buchanan Kimberli A | -- | None Listed On Document | |
| Buchanan Kimberli A | -- | None Listed On Document | |
| Buchanan Bryce J | -- | Equity Title Ins Agency Inc | |
| Richins Frank | -- | Equity Title Agency | |
| Mason Denise W | -- | United Title Services |
Source: Public Records
Mortgage History
| Date | Status | Borrower | Loan Amount |
|---|---|---|---|
| Previous Owner | Buchanan Bryce J | $604,800 | |
| Previous Owner | Richins Frank | $376,446 |
Source: Public Records
Tax History Compared to Growth
Tax History
| Year | Tax Paid | Tax Assessment Tax Assessment Total Assessment is a certain percentage of the fair market value that is determined by local assessors to be the total taxable value of land and additions on the property. | Land | Improvement |
|---|---|---|---|---|
| 2025 | $8,060 | $666,050 | $236,500 | $429,550 |
| 2024 | $7,227 | $604,450 | $198,000 | $406,450 |
| 2023 | $6,996 | $1,071,000 | $350,078 | $720,922 |
| 2022 | $7,325 | $631,950 | $187,774 | $444,176 |
| 2021 | $6,763 | $891,000 | $295,241 | $595,759 |
| 2020 | $6,346 | $826,000 | $240,614 | $585,386 |
| 2019 | $6,417 | $829,000 | $219,178 | $609,822 |
| 2018 | $6,089 | $777,000 | $187,490 | $589,510 |
| 2016 | $5,413 | $374,440 | $86,610 | $287,830 |
| 2015 | $5,957 | $394,185 | $86,610 | $307,575 |
| 2014 | $5,026 | $334,945 | $86,610 | $248,335 |
| 2013 | -- | $285,767 | $98,522 | $187,245 |
Source: Public Records
Map
Nearby Homes
- 280 N 1100 W
- Carson Plan at Amberly Place
- 2050 Farmhouse Plan at Amberly Place
- Pasadena (Inactive) Plan at Amberly Place
- Portland Plan at Amberly Place
- 1075 W Audrey Ln Unit 6
- 1067 W Audrey Ln Unit 8
- 1072 W Audrey Ln Unit 17
- 1064 W Audrey Ln Unit 15
- 1056 W Audrey Ln Unit 14
- 1069 W Linden Ln Unit 31
- 767 W 220 N
- 1309 W 1200 S
- 1334 W 1300 S
- 1422 W 1300 S
- 680 W 500 S Unit 22
- 680 W 500 S Unit 17
- 1288 S 1050 W
- 825 W 1320 N
- 758 W 1000 S
- 1243 Millbridge Ln Unit 23
- 1263 Millbridge Ln
- 1217 Millbridge Ln
- 1217 Millbridge Ln Unit 24
- 1226 Millbridge Ln
- 1226 Millbridge Ln Unit 6
- 1226 Millbridge Ln Unit 5
- 1250 Millbridge Ln
- 1287 Millbridge Ln Unit 21
- 1287 Millbridge Ln
- 38 S Belcourt Cir Unit 8
- 38 S Belcourt Cir
- 37 S Belcourt Cir Unit 8
- 1405 Millbridge Ln Unit 15
- 1204 Millbridge Ln Unit 4
- 1191 Millbridge Ln
- 1191 Millbridge Ln Unit 25
- 1272 Millbridge Ln
- 1204 Millbridge Ln
- 1307 Millbridge Ln Unit 20