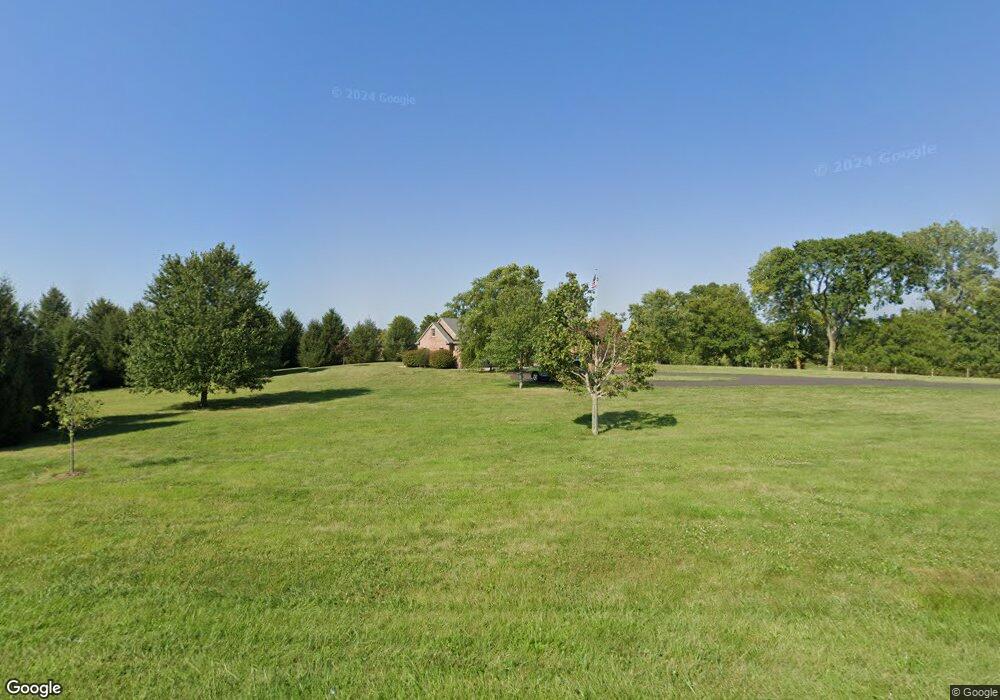
1243 N Grandison Rd Charlottesville, IN 46117
Estimated Value: $395,000 - $647,491
3
Beds
4
Baths
3,695
Sq Ft
$141/Sq Ft
Est. Value
About This Home
This home is located at 1243 N Grandison Rd, Charlottesville, IN 46117 and is currently estimated at $521,623, approximately $141 per square foot. 1243 N Grandison Rd is a home located in Hancock County with nearby schools including Eastern Hancock Elementary School, Eastern Hancock Middle School, and Eastern Hancock High School.
Ownership History
Date
Name
Owned For
Owner Type
Purchase Details
Closed on
Feb 28, 2023
Sold by
Fout Barry J
Bought by
Edwards Skylar Trent
Current Estimated Value
Create a Home Valuation Report for This Property
The Home Valuation Report is an in-depth analysis detailing your home's value as well as a comparison with similar homes in the area
Home Values in the Area
Average Home Value in this Area
Purchase History
| Date | Buyer | Sale Price | Title Company |
|---|---|---|---|
| Edwards Skylar Trent | $550,000 | Ata National Title Group Of In |
Source: Public Records
Tax History Compared to Growth
Tax History
| Year | Tax Paid | Tax Assessment Tax Assessment Total Assessment is a certain percentage of the fair market value that is determined by local assessors to be the total taxable value of land and additions on the property. | Land | Improvement |
|---|---|---|---|---|
| 2024 | $3,459 | $494,000 | $91,200 | $402,800 |
| 2023 | $3,459 | $466,400 | $88,500 | $377,900 |
| 2022 | $2,969 | $434,200 | $46,800 | $387,400 |
| 2021 | $2,719 | $361,700 | $45,400 | $316,300 |
| 2020 | $2,603 | $336,900 | $45,300 | $291,600 |
| 2019 | $2,481 | $326,800 | $47,300 | $279,500 |
| 2018 | $2,481 | $330,500 | $47,600 | $282,900 |
| 2017 | $2,442 | $319,900 | $49,300 | $270,600 |
| 2016 | $2,340 | $319,400 | $49,000 | $270,400 |
| 2014 | $2,195 | $299,000 | $48,500 | $250,500 |
| 2013 | -- | $290,600 | $46,500 | $244,100 |
Source: Public Records
Map
Nearby Homes
- 132 S East St
- 225 S Carthage Rd
- 11020 W Us Highway 40
- NO STREET NUMBER E Us Highway 40
- 5964 E 250 N
- 9020 W 650 S
- 9853 W County Road 550 S
- 6717 Indiana 109
- 10750 E 550 N
- 306 Blue River Dr
- 315 Blue River Dr
- 324 Blue River Dr
- 307 Blue River Dr
- 308 Blue River Dr
- 322 Blue River Dr
- 32 N Mccullum St
- 8594 N 900 W
- 1205 N Grandison Rd
- 1320 N Grandison Rd
- 9755 E County Road 100 N
- 9755 E 100 N
- 917 N Grandison Rd
- 150 E North St
- 914 N Grandison Rd
- 1466 N Grandison Rd
- 10044 E County Road 150 N
- 1530 N Grandison Rd
- 100 E North St Unit 9755
- 10202 E County Road 150 N
- 1100 E County Road 150 N
- 1100 E County Road 150 N
- 1090 E 150 N
- 1090 E County Road 150 N
- 1100 E 150 N
- 317 N Grandison Rd
- 10267 E County Road 150 N
- 677 N Grandison Rd