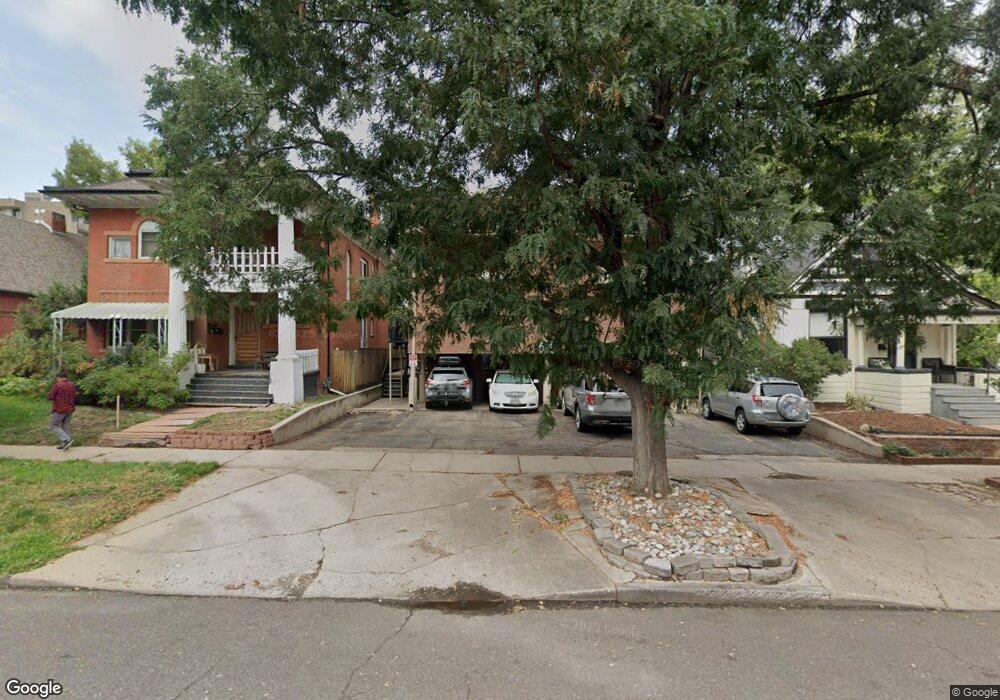
1243 Vine St Unit 4 Denver, CO 80206
Cheesman Park NeighborhoodEstimated Value: $241,000 - $319,000
2
Beds
2
Baths
707
Sq Ft
$416/Sq Ft
Est. Value
About This Home
This home is located at 1243 Vine St Unit 4, Denver, CO 80206 and is currently estimated at $294,285, approximately $416 per square foot. 1243 Vine St Unit 4 is a home located in Denver County with nearby schools including Bromwell Elementary School, Morey Middle School, and East High School.
Ownership History
Date
Name
Owned For
Owner Type
Purchase Details
Closed on
Feb 26, 2008
Sold by
Homesales Inc
Bought by
Heywood Ronald G
Current Estimated Value
Home Financials for this Owner
Home Financials are based on the most recent Mortgage that was taken out on this home.
Original Mortgage
$111,549
Outstanding Balance
$67,195
Interest Rate
5.47%
Mortgage Type
FHA
Estimated Equity
$227,090
Purchase Details
Closed on
Jul 3, 2007
Sold by
Johnson Mark D
Bought by
Homesales Inc
Purchase Details
Closed on
Oct 15, 2004
Sold by
Welch Daniel R
Bought by
Johnson Mark D
Home Financials for this Owner
Home Financials are based on the most recent Mortgage that was taken out on this home.
Original Mortgage
$131,120
Interest Rate
6.99%
Mortgage Type
Stand Alone First
Purchase Details
Closed on
Feb 26, 2002
Sold by
Observatory Park Condominiums Llc
Bought by
Welch Daniel R
Home Financials for this Owner
Home Financials are based on the most recent Mortgage that was taken out on this home.
Original Mortgage
$147,700
Interest Rate
5.87%
Create a Home Valuation Report for This Property
The Home Valuation Report is an in-depth analysis detailing your home's value as well as a comparison with similar homes in the area
Home Values in the Area
Average Home Value in this Area
Purchase History
| Date | Buyer | Sale Price | Title Company |
|---|---|---|---|
| Heywood Ronald G | $113,300 | Fahtco | |
| Homesales Inc | -- | None Available | |
| Johnson Mark D | $163,900 | -- | |
| Welch Daniel R | $155,500 | -- |
Source: Public Records
Mortgage History
| Date | Status | Borrower | Loan Amount |
|---|---|---|---|
| Open | Heywood Ronald G | $111,549 | |
| Previous Owner | Johnson Mark D | $131,120 | |
| Previous Owner | Welch Daniel R | $147,700 | |
| Closed | Johnson Mark D | $32,780 |
Source: Public Records
Tax History
| Year | Tax Paid | Tax Assessment Tax Assessment Total Assessment is a certain percentage of the fair market value that is determined by local assessors to be the total taxable value of land and additions on the property. | Land | Improvement |
|---|---|---|---|---|
| 2025 | $1,495 | $21,950 | $3,650 | $3,650 |
| 2024 | $1,495 | $18,880 | $3,100 | $15,780 |
| 2023 | $1,463 | $18,880 | $3,100 | $15,780 |
| 2022 | $1,420 | $17,850 | $3,210 | $14,640 |
| 2021 | $1,370 | $18,360 | $3,300 | $15,060 |
| 2020 | $1,479 | $19,940 | $2,910 | $17,030 |
| 2019 | $1,438 | $19,940 | $2,910 | $17,030 |
| 2018 | $1,106 | $14,290 | $2,740 | $11,550 |
| 2017 | $1,102 | $14,290 | $2,740 | $11,550 |
| 2016 | $1,151 | $14,120 | $2,595 | $11,525 |
| 2015 | $1,103 | $14,120 | $2,595 | $11,525 |
| 2014 | $937 | $11,280 | $1,695 | $9,585 |
Source: Public Records
Map
Nearby Homes
- 1245 Race St Unit 307
- 1223 Race St Unit 803
- 1265 Race St Unit 302
- 1265 Race St Unit 506
- 1265 Race St Unit 301
- 1200 Vine St Unit 4B
- 1200 Vine St Unit 8
- 1243 N Gaylord St Unit 205
- 1243 Gaylord St Unit 304
- 1330 Race St Unit 3
- 1330 Race St Unit 4
- 1150 Vine St Unit 306
- 1150 Vine St Unit 1003
- 1133 Race St Unit 17A
- 1321 Gaylord St
- 1111 Race St Unit PH-A
- 1111 Race St Unit 3A
- 1111 Race St Unit 4B
- 1332 N Williams St Unit 202
- 1355 Gaylord St Unit 4
- 1243 Vine St Unit 12
- 1243 Vine St Unit 11
- 1243 Vine St Unit 9
- 1243 Vine St Unit 8
- 1243 Vine St Unit 7
- 1243 Vine St Unit 6
- 1243 Vine St Unit 5
- 1243 Vine St Unit 3
- 1243 Vine St Unit 2
- 1243 Vine St Unit 1
- 1245 Vine St
- 1235 Vine St
- 1225 Vine St
- 1257 Vine St
- 1242 Race St
- 1258 Race St
- 1267 Vine St
- 1226 Race St
- 1232 Race St
- 1238 Race St
Your Personal Tour Guide
Ask me questions while you tour the home.