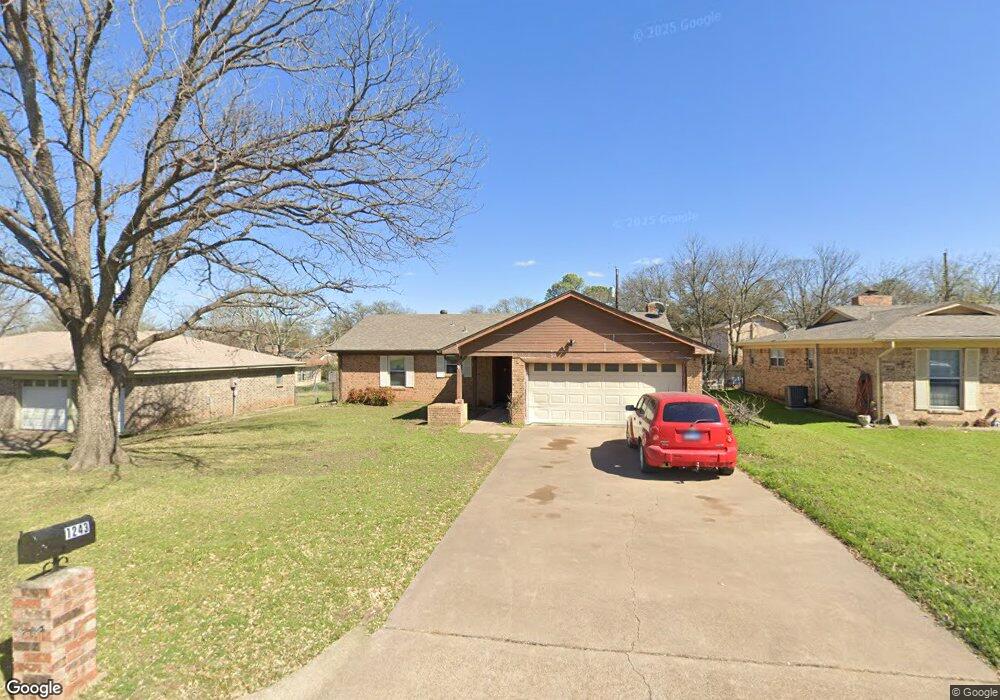
1243 Willowwood Dr Cleburne, TX 76033
Estimated Value: $220,000 - $252,000
3
Beds
2
Baths
1,310
Sq Ft
$178/Sq Ft
Est. Value
About This Home
This home is located at 1243 Willowwood Dr, Cleburne, TX 76033 and is currently estimated at $232,766, approximately $177 per square foot. 1243 Willowwood Dr is a home located in Johnson County with nearby schools including Coleman Elementary School, Lowell Smith Jr. Middle School, and Cleburne High School.
Ownership History
Date
Name
Owned For
Owner Type
Purchase Details
Closed on
Oct 7, 2022
Sold by
Jones Dow A
Bought by
Sims Property Management Llc
Current Estimated Value
Home Financials for this Owner
Home Financials are based on the most recent Mortgage that was taken out on this home.
Original Mortgage
$171,100
Outstanding Balance
$164,069
Interest Rate
5.55%
Mortgage Type
Balloon
Estimated Equity
$68,697
Purchase Details
Closed on
May 23, 2022
Sold by
Jones Ted D
Bought by
Jones Dow A and Rockett Tedi J
Purchase Details
Closed on
Jan 12, 2005
Sold by
Miller Floyd Raymond and Miller Phyllis Kay
Bought by
Chandler Gary W and Chandler Laurie M
Home Financials for this Owner
Home Financials are based on the most recent Mortgage that was taken out on this home.
Original Mortgage
$38,700
Interest Rate
5.8%
Mortgage Type
Purchase Money Mortgage
Create a Home Valuation Report for This Property
The Home Valuation Report is an in-depth analysis detailing your home's value as well as a comparison with similar homes in the area
Home Values in the Area
Average Home Value in this Area
Purchase History
| Date | Buyer | Sale Price | Title Company |
|---|---|---|---|
| Sims Property Management Llc | -- | Stewart Title | |
| Jones Dow A | -- | Marshall Neal Bridges | |
| Chandler Gary W | -- | None Available |
Source: Public Records
Mortgage History
| Date | Status | Borrower | Loan Amount |
|---|---|---|---|
| Open | Sims Property Management Llc | $171,100 | |
| Previous Owner | Chandler Gary W | $38,700 |
Source: Public Records
Tax History Compared to Growth
Tax History
| Year | Tax Paid | Tax Assessment Tax Assessment Total Assessment is a certain percentage of the fair market value that is determined by local assessors to be the total taxable value of land and additions on the property. | Land | Improvement |
|---|---|---|---|---|
| 2025 | $4,584 | $205,573 | $50,000 | $155,573 |
| 2024 | $4,584 | $205,573 | $50,000 | $155,573 |
| 2023 | $4,575 | $205,573 | $50,000 | $155,573 |
| 2022 | $3,782 | $169,156 | $45,000 | $124,156 |
| 2021 | $3,585 | $142,080 | $36,000 | $106,080 |
| 2020 | $3,461 | $131,080 | $25,000 | $106,080 |
| 2019 | $3,355 | $133,096 | $25,000 | $108,096 |
| 2018 | $3,051 | $103,223 | $25,000 | $78,223 |
| 2017 | $2,874 | $103,223 | $25,000 | $78,223 |
| 2016 | $2,612 | $88,744 | $20,000 | $68,744 |
| 2015 | $923 | $88,744 | $20,000 | $68,744 |
| 2014 | $923 | $89,089 | $20,000 | $69,089 |
Source: Public Records
Map
Nearby Homes
- 504 S Colonial Dr
- 1225 Crestwood Dr
- 800 Misty Ln
- 1309 Wedgewood Dr
- 1204 W Westhill Dr
- 709 Stonelake Dr
- 806 S Colonial Dr
- 1116 Willowcreek Rd
- 1211 Greenbriar Ln
- 1103 Trace Rd
- 1115 Green River Trail
- 325 Wildrose Cir
- 840 S Ridgeway Dr
- 380 Wildrose Cir
- 4112 Highland Dr
- 4101 Highland Dr
- 1208 Cindy Ln
- 509 S Nolan River Rd
- 1327 Hemphill Dr
- 1302 Cindy Ct
- 1245 Willowwood Dr
- 1241 Willowwood Dr
- 1236 Wedgewood Dr
- 1247 Willowwood Dr
- 1239 Willowwood Dr
- 1238 Wedgewood Dr
- 1246 Willowwood Dr
- 1234 Wedgewood Dr
- 1242 Willowwood Dr
- 1240 Wedgewood Dr
- 1248 Willowwood Dr
- 1237 Willowwood Dr
- 1249 Willowwood Dr
- 1232 Wedgewood Dr
- 1240 Willowwood Dr
- 503 S Colonial Dr
- 501 S Colonial Dr
- 1235 Willowwood Dr
- 1251 Willowwood Dr
- 1242 Wedgewood Dr