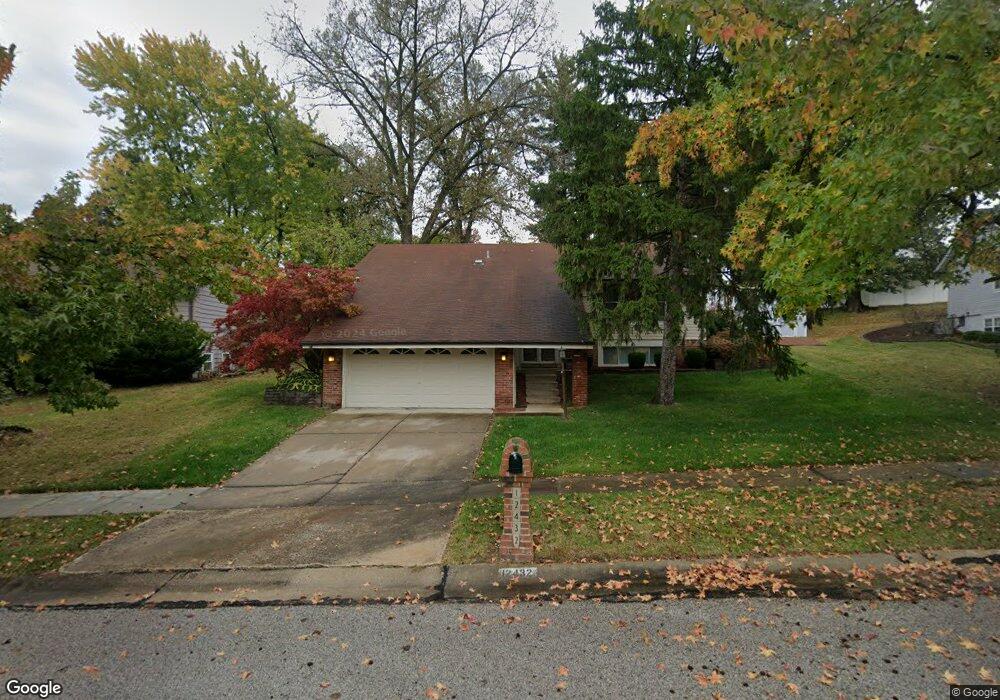
12432 Sandycreek Ln Florissant, MO 63033
Estimated Value: $206,000 - $229,000
3
Beds
3
Baths
1,228
Sq Ft
$177/Sq Ft
Est. Value
About This Home
This home is located at 12432 Sandycreek Ln, Florissant, MO 63033 and is currently estimated at $217,745, approximately $177 per square foot. 12432 Sandycreek Ln is a home located in St. Louis County with nearby schools including Jamestown Elementary School, Central Middle School, and Hazelwood Central High School.
Ownership History
Date
Name
Owned For
Owner Type
Purchase Details
Closed on
Feb 22, 2001
Sold by
Bank One National Assn
Bought by
Edwards Timon
Current Estimated Value
Home Financials for this Owner
Home Financials are based on the most recent Mortgage that was taken out on this home.
Original Mortgage
$86,218
Outstanding Balance
$31,399
Interest Rate
7.19%
Mortgage Type
FHA
Estimated Equity
$186,346
Purchase Details
Closed on
Sep 13, 2000
Sold by
Carson Donaldson Delores
Bought by
Bank One National Assn
Purchase Details
Closed on
Mar 25, 1998
Sold by
Herbert Brown and Herbert Bertha T
Bought by
Donaldson Delores Carson and Donaldson Delores A
Home Financials for this Owner
Home Financials are based on the most recent Mortgage that was taken out on this home.
Original Mortgage
$78,100
Interest Rate
10.62%
Create a Home Valuation Report for This Property
The Home Valuation Report is an in-depth analysis detailing your home's value as well as a comparison with similar homes in the area
Home Values in the Area
Average Home Value in this Area
Purchase History
| Date | Buyer | Sale Price | Title Company |
|---|---|---|---|
| Edwards Timon | $86,900 | -- | |
| Edwards Timon | $86,900 | -- | |
| Bank One National Assn | $90,634 | First American Title | |
| Donaldson Delores Carson | -- | -- |
Source: Public Records
Mortgage History
| Date | Status | Borrower | Loan Amount |
|---|---|---|---|
| Open | Edwards Timon | $86,218 | |
| Closed | Edwards Timon | $86,218 | |
| Previous Owner | Donaldson Delores Carson | $78,100 | |
| Closed | Donaldson Delores Carson | $9,190 |
Source: Public Records
Tax History Compared to Growth
Tax History
| Year | Tax Paid | Tax Assessment Tax Assessment Total Assessment is a certain percentage of the fair market value that is determined by local assessors to be the total taxable value of land and additions on the property. | Land | Improvement |
|---|---|---|---|---|
| 2025 | $2,995 | $37,980 | $4,900 | $33,080 |
| 2024 | $2,995 | $33,210 | $4,900 | $28,310 |
| 2023 | $2,988 | $33,210 | $4,900 | $28,310 |
| 2022 | $2,762 | $26,160 | $5,720 | $20,440 |
| 2021 | $2,641 | $26,160 | $5,720 | $20,440 |
| 2020 | $2,556 | $23,880 | $3,760 | $20,120 |
| 2019 | $2,521 | $23,880 | $3,760 | $20,120 |
| 2018 | $2,491 | $21,790 | $2,600 | $19,190 |
| 2017 | $2,488 | $21,790 | $2,600 | $19,190 |
| 2016 | $2,471 | $21,250 | $2,950 | $18,300 |
| 2015 | $2,415 | $21,250 | $2,950 | $18,300 |
| 2014 | $2,271 | $19,860 | $3,270 | $16,590 |
Source: Public Records
Map
Nearby Homes
- 12292 Jerries Ln
- 5226 Suntrail Dr
- 5432 Trailbend Dr
- 5372 Trailbend Dr
- 12582 Springtrail Dr
- 5348 Trailoaks Dr
- 5239 Trailoaks Dr
- 12320 Missile Ln
- 6320 Hadden Bay Dr
- 12095 El Camara Dr
- 6595 Dolphin Cir E Unit 131A
- 12136 La Padera Ln
- 12991 Mourville Ct
- 6587 Dolphin Cir E Unit 110B
- 12705 Stubwood Dr
- 12750 Needle Point Ct
- 6250 Pennyrich Ct
- 12111 La Padera Ln
- 11951 Jerries Ln
- 6470 White Cap Ln Unit D
- 12462 Sandycreek Ln
- 12402 Sandycreek Ln
- 5467 Suntrail Dr
- 12435 Jerries Ln
- 12482 Sandycreek Ln
- 12455 Jerries Ln
- 5497 Suntrail Dr
- 12465 Jerries Ln
- 5420 Sandycreek Ln
- 5460 Sandycreek Ln
- 5464 Suntrail Dr
- 5404 Suntrail Dr
- 12391 Jerries Ln
- 5398 Suntrail Dr
- 12434 Jerries Ln
- 12424 Jerries Ln
- 12444 Jerries Ln
- 5388 Suntrail Dr
- 12414 Jerries Ln
- 12454 Jerries Ln