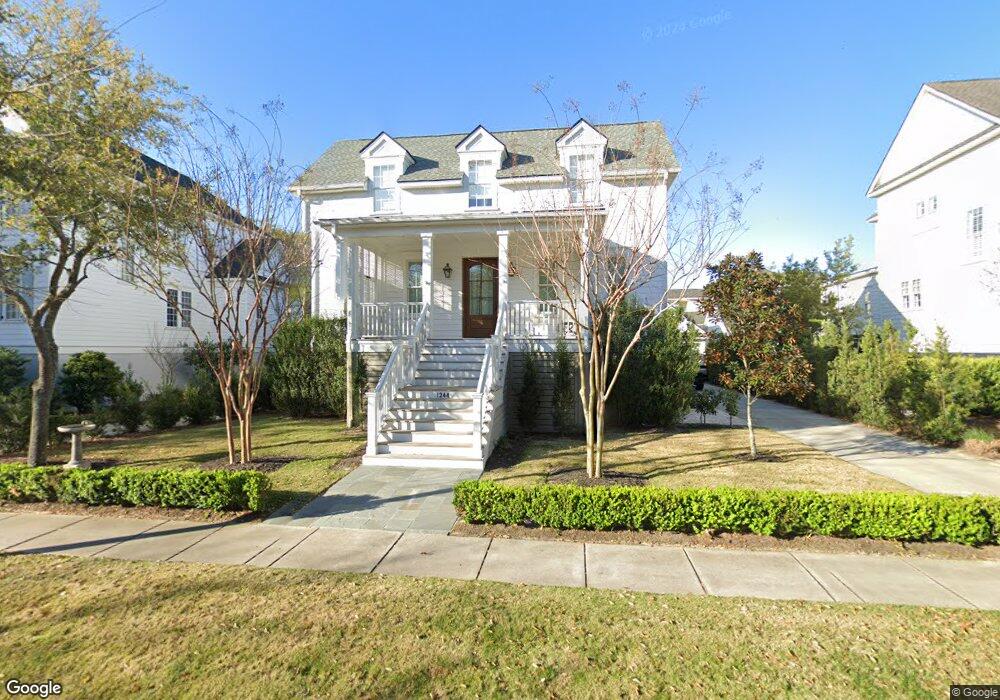
1244 Blakeway St Daniel Island, SC 29492
Daniel Island NeighborhoodEstimated Value: $1,290,547 - $1,458,000
3
Beds
4
Baths
2,325
Sq Ft
$594/Sq Ft
Est. Value
About This Home
This home is located at 1244 Blakeway St, Daniel Island, SC 29492 and is currently estimated at $1,381,887, approximately $594 per square foot. 1244 Blakeway St is a home located in Berkeley County with nearby schools including Daniel Island School and Bishop England High School.
Ownership History
Date
Name
Owned For
Owner Type
Purchase Details
Closed on
Mar 15, 2012
Sold by
Swanson David E and Swanson Brenda
Bought by
Swanson David E and Swanson Brenda
Current Estimated Value
Purchase Details
Closed on
Aug 27, 2010
Sold by
Quality Properties Asset Management Comp
Bought by
Swanson David E and Swanson Brenda
Home Financials for this Owner
Home Financials are based on the most recent Mortgage that was taken out on this home.
Original Mortgage
$396,000
Outstanding Balance
$263,607
Interest Rate
4.6%
Mortgage Type
Future Advance Clause Open End Mortgage
Estimated Equity
$1,118,280
Purchase Details
Closed on
Nov 28, 2006
Sold by
Daniel Island Associates Llc
Bought by
The J D Smith Co Inc
Home Financials for this Owner
Home Financials are based on the most recent Mortgage that was taken out on this home.
Original Mortgage
$2,261,600
Interest Rate
6.29%
Mortgage Type
Purchase Money Mortgage
Create a Home Valuation Report for This Property
The Home Valuation Report is an in-depth analysis detailing your home's value as well as a comparison with similar homes in the area
Home Values in the Area
Average Home Value in this Area
Purchase History
| Date | Buyer | Sale Price | Title Company |
|---|---|---|---|
| Swanson David E | -- | -- | |
| Swanson David E | $495,000 | -- | |
| The J D Smith Co Inc | $480,000 | None Available |
Source: Public Records
Mortgage History
| Date | Status | Borrower | Loan Amount |
|---|---|---|---|
| Open | Swanson David E | $396,000 | |
| Previous Owner | The J D Smith Co Inc | $2,261,600 |
Source: Public Records
Tax History Compared to Growth
Tax History
| Year | Tax Paid | Tax Assessment Tax Assessment Total Assessment is a certain percentage of the fair market value that is determined by local assessors to be the total taxable value of land and additions on the property. | Land | Improvement |
|---|---|---|---|---|
| 2025 | $4,356 | $714,837 | $239,396 | $475,441 |
| 2024 | $3,721 | $28,594 | $9,576 | $19,018 |
| 2023 | $3,721 | $24,726 | $8,742 | $15,984 |
| 2022 | $3,370 | $21,500 | $5,478 | $16,022 |
| 2021 | $3,431 | $21,500 | $5,478 | $16,022 |
| 2020 | $3,500 | $21,500 | $5,478 | $16,022 |
| 2019 | $3,565 | $21,500 | $5,478 | $16,022 |
| 2018 | $3,066 | $18,696 | $5,000 | $13,696 |
| 2017 | $3,419 | $18,696 | $5,000 | $13,696 |
| 2016 | $3,467 | $18,700 | $5,000 | $13,700 |
| 2015 | $3,240 | $18,700 | $5,000 | $13,700 |
| 2014 | $3,235 | $18,700 | $5,000 | $13,700 |
| 2013 | -- | $18,700 | $5,000 | $13,700 |
Source: Public Records
Map
Nearby Homes
- 1119 Oak Overhang St
- 1225 Blakeway St Unit 504
- 1225 Blakeway St Unit 906
- 1225 Blakeway St Unit 703
- 925 Fish Camp Rd
- 938 Fish Camp Rd
- 821 Roddin St
- 1709 Doldridge St
- 2038 Pierce St
- 1459 Wando Landing St
- 2548 Josiah St
- 1826 Pierce St
- 2555 Josiah St
- 1844 Pierce St
- 1507 Jenys St
- 1431 Wando View St
- 2267 Daniel Island Dr
- 1943 Pierce St
- 1659 Pierce St
- 1710 Trewin Ct
- 1248 Blakeway St
- 1240 Blakeway St
- 1107 Oak Overhang St
- 1102 Oak Overhang St
- 1236 Blakeway St
- 1113 Oak Overhang St
- 1232 Blakeway St
- 1108 Oak Overhang St
- 1257 Blakeway St
- 1256 Blakeway St
- 1112 Oak Overhang St
- 2431 Settlers St
- 1261 Blakeway St
- 2425 Settlers St
- 1260 Blakeway St
- 2419 Settlers St
- 2451 Settlers St
- 1120 Oak Overhang St
- 1234 Smythe St
- 1116 Oak Overhang St