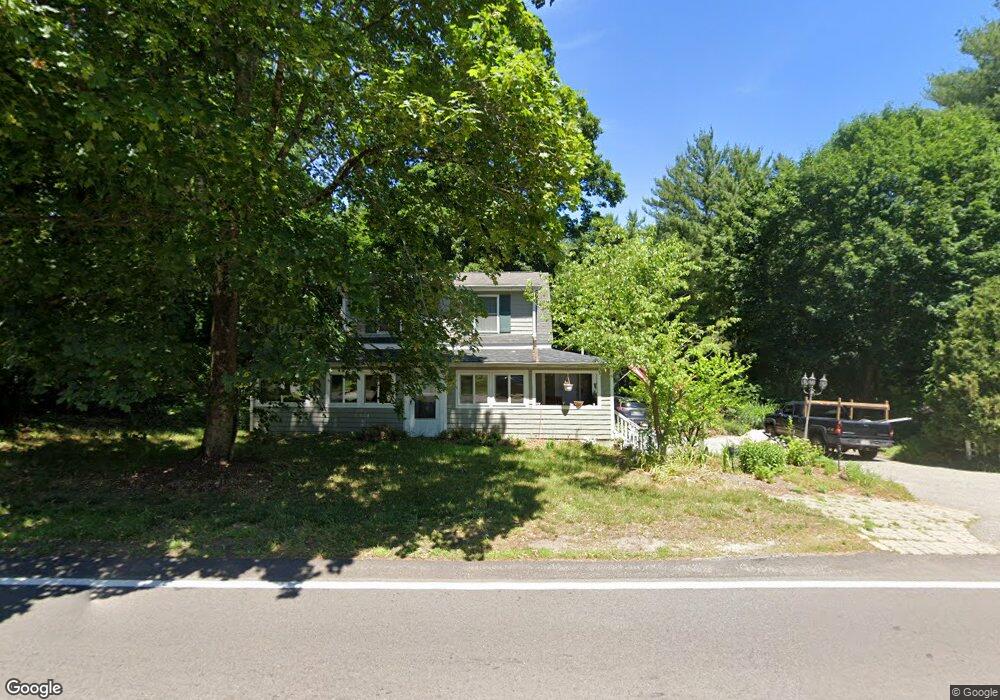
1244 Main St Hanson, MA 02341
Estimated Value: $363,000 - $512,000
2
Beds
2
Baths
1,250
Sq Ft
$366/Sq Ft
Est. Value
About This Home
This home is located at 1244 Main St, Hanson, MA 02341 and is currently estimated at $457,971, approximately $366 per square foot. 1244 Main St is a home located in Plymouth County.
Ownership History
Date
Name
Owned For
Owner Type
Purchase Details
Closed on
Mar 29, 2004
Sold by
Dignan Francis P and Dignan Laurie L
Bought by
Sargent Andrew D and Santos Anabela G
Current Estimated Value
Home Financials for this Owner
Home Financials are based on the most recent Mortgage that was taken out on this home.
Original Mortgage
$198,000
Outstanding Balance
$93,111
Interest Rate
5.65%
Mortgage Type
Purchase Money Mortgage
Estimated Equity
$364,860
Purchase Details
Closed on
Jun 29, 1994
Sold by
Hingham Inst Svgs Rt
Bought by
Jordan Warren R and Jordan Gretchen A
Home Financials for this Owner
Home Financials are based on the most recent Mortgage that was taken out on this home.
Original Mortgage
$105,000
Interest Rate
8.55%
Mortgage Type
Purchase Money Mortgage
Purchase Details
Closed on
Dec 23, 1993
Sold by
288 & 290 Washtn St Rt
Bought by
Hingham Inst Svgs Rt
Create a Home Valuation Report for This Property
The Home Valuation Report is an in-depth analysis detailing your home's value as well as a comparison with similar homes in the area
Home Values in the Area
Average Home Value in this Area
Purchase History
| Date | Buyer | Sale Price | Title Company |
|---|---|---|---|
| Sargent Andrew D | $220,000 | -- | |
| Jordan Warren R | $125,000 | -- | |
| Hingham Inst Svgs Rt | $125,003 | -- |
Source: Public Records
Mortgage History
| Date | Status | Borrower | Loan Amount |
|---|---|---|---|
| Open | Hingham Inst Svgs Rt | $198,000 | |
| Previous Owner | Hingham Inst Svgs Rt | $21,100 | |
| Previous Owner | Hingham Inst Svgs Rt | $105,000 |
Source: Public Records
Tax History
| Year | Tax Paid | Tax Assessment Tax Assessment Total Assessment is a certain percentage of the fair market value that is determined by local assessors to be the total taxable value of land and additions on the property. | Land | Improvement |
|---|---|---|---|---|
| 2025 | $5,447 | $407,100 | $161,700 | $245,400 |
| 2024 | $5,289 | $395,300 | $157,000 | $238,300 |
| 2023 | $4,314 | $304,200 | $157,000 | $147,200 |
| 2022 | $4,218 | $279,500 | $142,800 | $136,700 |
| 2021 | $3,793 | $251,200 | $137,300 | $113,900 |
| 2020 | $3,614 | $236,700 | $132,600 | $104,100 |
| 2019 | $3,521 | $226,700 | $130,100 | $96,600 |
| 2018 | $3,481 | $219,900 | $125,100 | $94,800 |
| 2017 | $11,744 | $211,200 | $119,100 | $92,100 |
| 2016 | $3,457 | $208,900 | $119,100 | $89,800 |
| 2015 | $3,299 | $207,200 | $119,100 | $88,100 |
Source: Public Records
Map
Nearby Homes
- 72 Phillips St
- 1054 Main St
- 170 Elm St
- 61 Sawmill Ln
- 61 Sawmill Ln Unit 61
- 1754 Central St
- 26 Franklin St
- 126-130 Franklin St
- 361A County Rd
- 361 County Rd
- Lot 6 Way
- Lot 2 Harvard Rd
- 501 W Washington St
- 23 Bell Dr
- 161 Winter St Unit 11
- 6 Amanda's Way Unit 6
- 84 Liberty St
- 318 South St
- Lot 5 Princeton Way
- 134 Crescent St
Your Personal Tour Guide
Ask me questions while you tour the home.