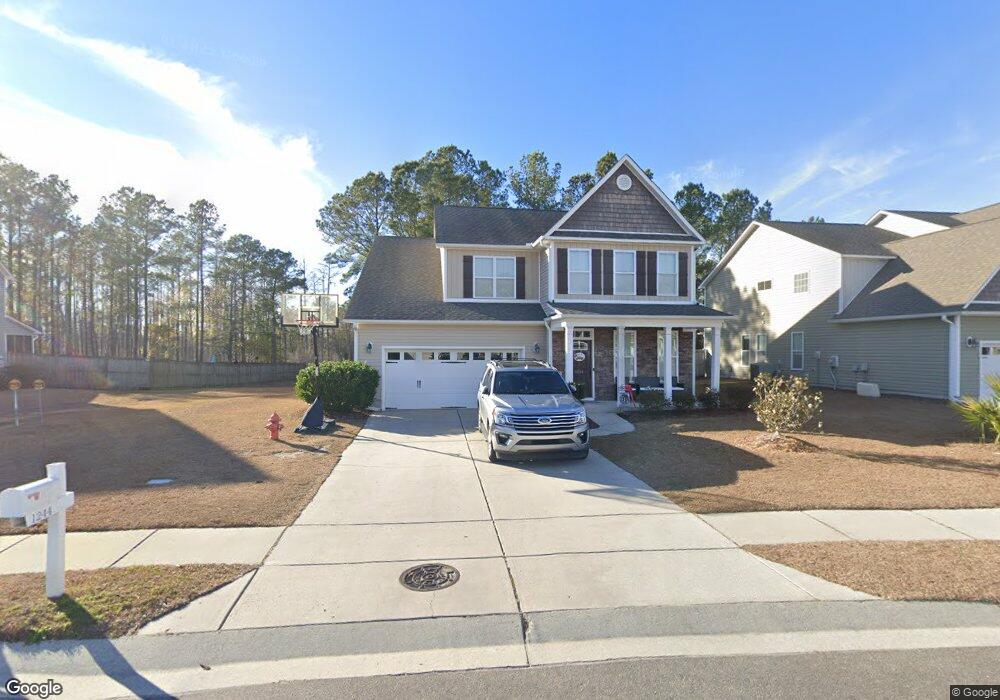
1244 South Brook Rd Winnabow, NC 28479
Estimated Value: $448,000 - $475,794
5
Beds
4
Baths
3,100
Sq Ft
$149/Sq Ft
Est. Value
About This Home
This home is located at 1244 South Brook Rd, Winnabow, NC 28479 and is currently estimated at $461,699, approximately $148 per square foot. 1244 South Brook Rd is a home located in Brunswick County with nearby schools including Belville Elementary School, Leland Middle School, and North Brunswick High School.
Ownership History
Date
Name
Owned For
Owner Type
Purchase Details
Closed on
May 21, 2021
Sold by
Daubner Carlton and Daubner Suzanne
Bought by
Bland Herman D and Bland Letonia N
Current Estimated Value
Home Financials for this Owner
Home Financials are based on the most recent Mortgage that was taken out on this home.
Original Mortgage
$268,620
Outstanding Balance
$242,672
Interest Rate
2.9%
Mortgage Type
FHA
Estimated Equity
$219,027
Purchase Details
Closed on
Apr 27, 2015
Sold by
Jones Alexander L and Jones Shevonya
Bought by
Daubner Carlton and Daubner Suzanne
Home Financials for this Owner
Home Financials are based on the most recent Mortgage that was taken out on this home.
Original Mortgage
$205,700
Interest Rate
3.87%
Mortgage Type
New Conventional
Purchase Details
Closed on
Feb 19, 2010
Sold by
Stevens Home Investments Inc
Bought by
Jones Alexander L and Jones Shevonya M
Home Financials for this Owner
Home Financials are based on the most recent Mortgage that was taken out on this home.
Original Mortgage
$239,059
Interest Rate
5.5%
Mortgage Type
FHA
Create a Home Valuation Report for This Property
The Home Valuation Report is an in-depth analysis detailing your home's value as well as a comparison with similar homes in the area
Home Values in the Area
Average Home Value in this Area
Purchase History
| Date | Buyer | Sale Price | Title Company |
|---|---|---|---|
| Bland Herman D | $330,000 | None Available | |
| Daubner Carlton | $242,000 | None Available | |
| Jones Alexander L | $243,500 | None Available |
Source: Public Records
Mortgage History
| Date | Status | Borrower | Loan Amount |
|---|---|---|---|
| Open | Bland Herman D | $268,620 | |
| Previous Owner | Daubner Carlton | $205,700 | |
| Previous Owner | Jones Alexander L | $239,059 |
Source: Public Records
Tax History
| Year | Tax Paid | Tax Assessment Tax Assessment Total Assessment is a certain percentage of the fair market value that is determined by local assessors to be the total taxable value of land and additions on the property. | Land | Improvement |
|---|---|---|---|---|
| 2025 | $3,225 | $428,890 | $54,000 | $374,890 |
| 2024 | $31 | $428,890 | $54,000 | $374,890 |
| 2023 | $2,477 | $428,890 | $54,000 | $374,890 |
| 2022 | $2,477 | $269,600 | $55,000 | $214,600 |
| 2021 | $2,477 | $269,600 | $55,000 | $214,600 |
| 2020 | $2,369 | $269,600 | $55,000 | $214,600 |
| 2019 | $2,324 | $56,520 | $55,000 | $1,520 |
| 2018 | $2,295 | $29,270 | $27,500 | $1,770 |
| 2017 | $2,295 | $29,270 | $27,500 | $1,770 |
| 2016 | $2,146 | $29,270 | $27,500 | $1,770 |
| 2015 | $2,058 | $276,210 | $27,500 | $248,710 |
| 2014 | $1,780 | $249,076 | $25,000 | $224,076 |
Source: Public Records
Map
Nearby Homes
- 335 St Kitts Way
- 1315 Star Grass Way
- 1159 Sandy Grove Place
- 5308 Black Oak Ct
- 3341 Hemlock Way
- 9638 Large Oak Ct Unit Lot 71
- 9634 Large Oak Ct
- 3330 Hemlock Way Unit Lot 128
- 6440 Saxon Meadow Dr
- 106 Emberwood Dr
- 5117 Stoney Point Dr
- 1244 N Sleepy Oak Ln
- 123 Emberwood Dr
- 543 Heartwood Dr
- 5090 Stoney Point Dr
- 5069 Roundhead Dr
- 6413 Pinnacle Point
- 2169 Simmerman Way
- 2041 Shelmore Way
- 2041 Blue Spruce Dr
- 1240 S Brook Rd
- 1244 S Brook Rd
- 1252 South Brook Rd
- 1240 South Brook Rd
- 1236 South Brook Rd
- 1236 S Brook Rd
- 1252 S Brook Rd
- 1256 South Brook Rd
- 1241 South Brook Rd
- 1241 S Brook Rd
- 1256 S Brook Rd
- 1245 South Brook Rd
- 1245 S Brook Rd
- 1232 South Brook Rd
- 1257 South Brook Rd
- 1257 S Brook Rd
- 1260 S Brook Rd
- 1260 South Brook Rd
- 1233 S South Brook Rd
- 1233 South Brook Rd
Your Personal Tour Guide
Ask me questions while you tour the home.