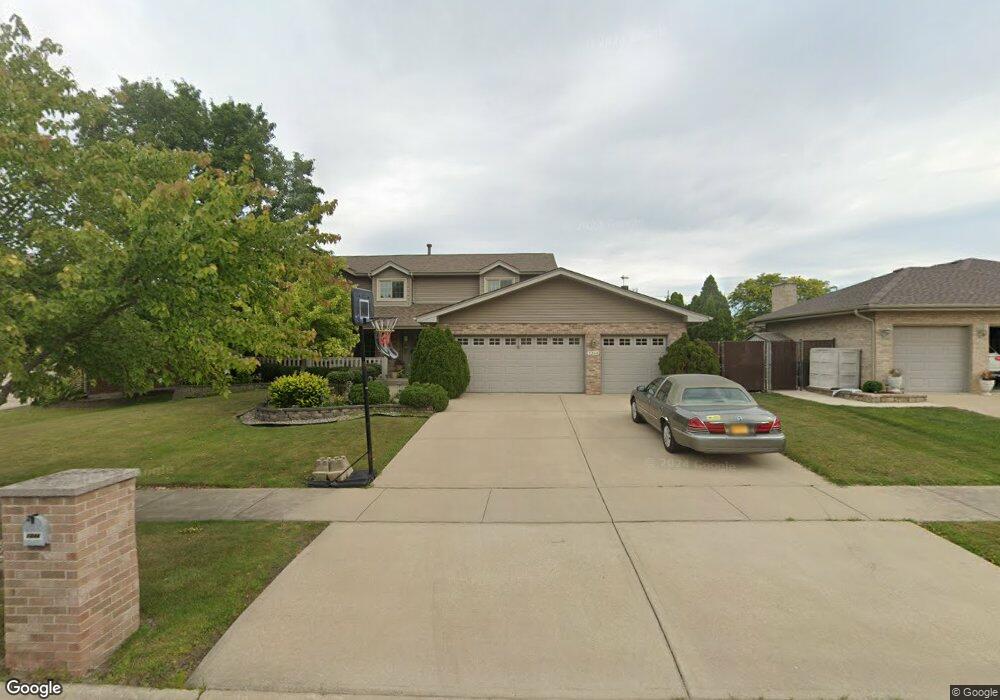
1244 Tralee Ln Unit 4 Lockport, IL 60441
Estimated Value: $536,520 - $615,000
5
Beds
4
Baths
3,100
Sq Ft
$185/Sq Ft
Est. Value
About This Home
This home is located at 1244 Tralee Ln Unit 4, Lockport, IL 60441 and is currently estimated at $573,130, approximately $184 per square foot. 1244 Tralee Ln Unit 4 is a home located in Will County with nearby schools including Walsh Elementary School, Ludwig Elementary School, and Reed Elementary School.
Ownership History
Date
Name
Owned For
Owner Type
Purchase Details
Closed on
Apr 19, 2024
Sold by
Delfinado Rodney L and Delfinado Julie M
Bought by
Delfinado Family Trust and Delfinado
Current Estimated Value
Purchase Details
Closed on
Sep 2, 2011
Sold by
Willis John D and Willis Lisa M
Bought by
Delfinado Rodney and Delfinado Julie
Home Financials for this Owner
Home Financials are based on the most recent Mortgage that was taken out on this home.
Original Mortgage
$224,000
Interest Rate
4.4%
Mortgage Type
New Conventional
Purchase Details
Closed on
Jun 6, 2000
Sold by
Nlsb
Bought by
Willis John D and Willis Lisa M
Home Financials for this Owner
Home Financials are based on the most recent Mortgage that was taken out on this home.
Original Mortgage
$207,300
Interest Rate
8.55%
Create a Home Valuation Report for This Property
The Home Valuation Report is an in-depth analysis detailing your home's value as well as a comparison with similar homes in the area
Home Values in the Area
Average Home Value in this Area
Purchase History
| Date | Buyer | Sale Price | Title Company |
|---|---|---|---|
| Delfinado Family Trust | -- | None Listed On Document | |
| Delfinado Rodney | $280,000 | Fidelity National Title | |
| Willis John D | $244,000 | Chicago Title Insurance Co |
Source: Public Records
Mortgage History
| Date | Status | Borrower | Loan Amount |
|---|---|---|---|
| Previous Owner | Delfinado Rodney | $224,000 | |
| Previous Owner | Willis John D | $207,300 |
Source: Public Records
Tax History
| Year | Tax Paid | Tax Assessment Tax Assessment Total Assessment is a certain percentage of the fair market value that is determined by local assessors to be the total taxable value of land and additions on the property. | Land | Improvement |
|---|---|---|---|---|
| 2024 | $12,781 | $161,852 | $30,388 | $131,464 |
| 2023 | $12,781 | $145,302 | $27,281 | $118,021 |
| 2022 | $11,504 | $136,881 | $25,700 | $111,181 |
| 2021 | $10,839 | $128,636 | $24,152 | $104,484 |
| 2020 | $10,556 | $124,406 | $23,358 | $101,048 |
| 2019 | $9,967 | $117,920 | $22,140 | $95,780 |
| 2018 | $10,195 | $117,920 | $22,140 | $95,780 |
| 2017 | $9,738 | $111,319 | $20,901 | $90,418 |
| 2016 | $9,238 | $104,329 | $19,589 | $84,740 |
| 2015 | $8,610 | $99,266 | $18,638 | $80,628 |
| 2014 | $8,610 | $94,539 | $17,750 | $76,789 |
| 2013 | $8,610 | $94,539 | $17,750 | $76,789 |
Source: Public Records
Map
Nearby Homes
- 0 151st & MacGregor St Unit MRD11873272
- 0 Smith Rd South of 135th St Unit MRD12274096
- 0 N State St Unit 10995892
- 1336 Tralee Ln
- 904 Cove Ave
- 15303 S Oak Run Ct
- 14934 S Hillside Dr
- 16740 W Saddlewood Dr
- 514 N Lockwood Dr
- 14838 S Hillside Dr
- 805 Maryknoll Dr
- 16542 Golden Valley Ln
- 16535 Golden Valley Ln
- 936 Treeline Ct Unit 5B
- 927 Treeline Ct Unit A
- 16553 W Golden Valley Ln
- 310 Mccameron Ave
- 1400 Smith Rd
- Vacant High Rd
- 17528 Woodbrook Ln
- 1240 Tralee Ln
- 1248 Tralee Ln
- 1236 Tralee Ln
- 1252 Tralee Ln
- 1245 Tralee Ln
- 1249 Tralee Ln Unit 4
- 1241 Tralee Ln
- 1248 W 151st St
- 1232 Tralee Ln
- 1237 Tralee Ln
- 1253 Tralee Ln
- 15024 Bunratty Dr
- 1305 Tralee Ln
- 1228 Tralee Ln
- 1256 W 151st St
- 1044 Bunratty Dr
- 1233 Tralee Ln
- 1224 W 151st St
- 15020 Bunratty Dr
- 1033 Glenmore Cir
Your Personal Tour Guide
Ask me questions while you tour the home.