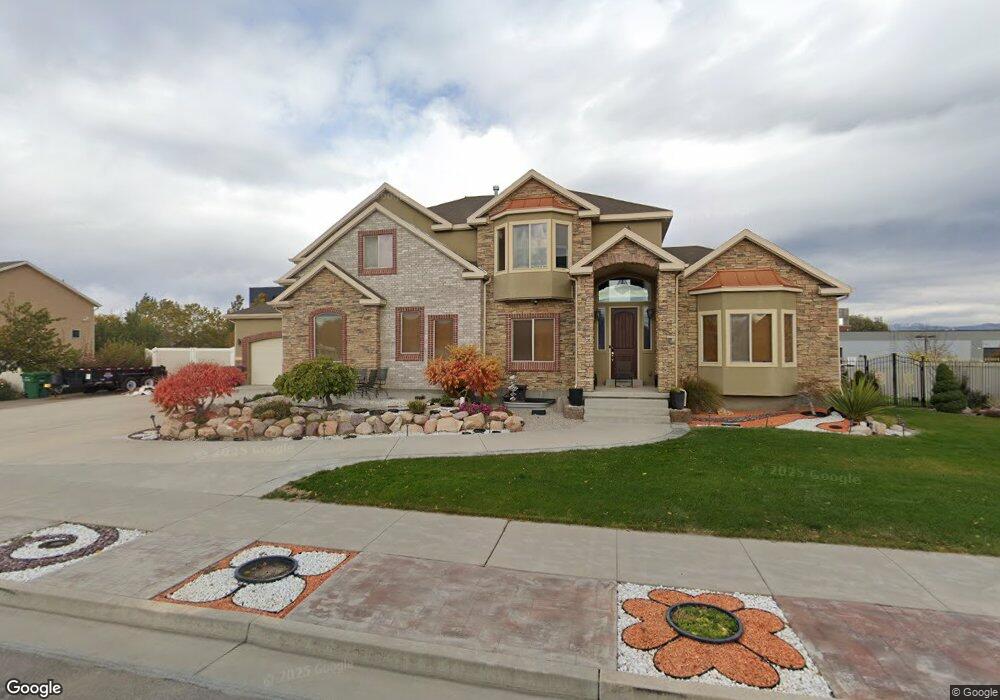
1244 W Michaelsen Way Unit 219 West Jordan, UT 84088
Estimated Value: $690,000 - $980,000
3
Beds
2
Baths
2,698
Sq Ft
$323/Sq Ft
Est. Value
About This Home
This home is located at 1244 W Michaelsen Way Unit 219, West Jordan, UT 84088 and is currently estimated at $872,063, approximately $323 per square foot. 1244 W Michaelsen Way Unit 219 is a home located in Salt Lake County with nearby schools including Riverside Elementary School, West Jordan Middle School, and West Jordan High School.
Ownership History
Date
Name
Owned For
Owner Type
Purchase Details
Closed on
Sep 12, 2012
Sold by
Bryce Hansen Construction Inc
Bought by
Pham Truong and Pham Thang
Current Estimated Value
Home Financials for this Owner
Home Financials are based on the most recent Mortgage that was taken out on this home.
Original Mortgage
$348,319
Outstanding Balance
$237,355
Interest Rate
3.25%
Mortgage Type
FHA
Estimated Equity
$634,708
Purchase Details
Closed on
Feb 28, 2012
Sold by
Mcdougal Douglas
Bought by
Bryce Hansen Construction Inc
Home Financials for this Owner
Home Financials are based on the most recent Mortgage that was taken out on this home.
Original Mortgage
$276,000
Interest Rate
3.83%
Mortgage Type
Future Advance Clause Open End Mortgage
Purchase Details
Closed on
Nov 12, 2010
Sold by
Dinkelman Jerry
Bought by
Mcdougal Douglas C
Home Financials for this Owner
Home Financials are based on the most recent Mortgage that was taken out on this home.
Original Mortgage
$350,000
Interest Rate
10%
Mortgage Type
Purchase Money Mortgage
Create a Home Valuation Report for This Property
The Home Valuation Report is an in-depth analysis detailing your home's value as well as a comparison with similar homes in the area
Home Values in the Area
Average Home Value in this Area
Purchase History
| Date | Buyer | Sale Price | Title Company |
|---|---|---|---|
| Pham Truong | -- | Keystone Title Ins Midvale | |
| Bryce Hansen Construction Inc | -- | Pioneer Title Ins Agcy | |
| Mcdougal Douglas C | -- | Meridian Title |
Source: Public Records
Mortgage History
| Date | Status | Borrower | Loan Amount |
|---|---|---|---|
| Open | Pham Truong | $348,319 | |
| Previous Owner | Bryce Hansen Construction Inc | $276,000 | |
| Previous Owner | Mcdougal Douglas C | $350,000 |
Source: Public Records
Tax History Compared to Growth
Tax History
| Year | Tax Paid | Tax Assessment Tax Assessment Total Assessment is a certain percentage of the fair market value that is determined by local assessors to be the total taxable value of land and additions on the property. | Land | Improvement |
|---|---|---|---|---|
| 2025 | $4,044 | $860,900 | $373,100 | $487,800 |
| 2024 | $4,044 | $763,000 | $363,300 | $399,700 |
| 2023 | $4,111 | $731,100 | $295,600 | $435,500 |
| 2022 | $4,110 | $719,100 | $289,800 | $429,300 |
| 2021 | $3,570 | $567,100 | $232,700 | $334,400 |
| 2020 | $3,471 | $509,200 | $221,600 | $287,600 |
| 2019 | $3,395 | $496,000 | $209,100 | $286,900 |
| 2018 | $3,278 | $474,400 | $209,100 | $265,300 |
| 2017 | $3,059 | $440,100 | $209,100 | $231,000 |
| 2016 | $3,139 | $424,500 | $163,000 | $261,500 |
| 2015 | $2,991 | $394,000 | $173,900 | $220,100 |
| 2014 | $2,865 | $371,200 | $166,100 | $205,100 |
Source: Public Records
Map
Nearby Homes
- 1184 W Michaelsen Way
- 9141 S Little Creek Dr
- 9095 S 1150 W
- 9297 S Avignon Place
- 9121 S Hidden Peak Dr
- 8686 S Temple Dr
- 8976 S 1050 W
- 8843 Capernaum Rd
- 1424 Stone Meadow Dr
- 1116 W 9440 S
- 1352 W 8780 S
- 8772 S Midvalley Dr
- 8686 S Temple Dr
- 1254 W 8680 S
- 9532 S Willow Trail Way
- 8713 Mountain Meadow Dr
- 8686 Covewood Place
- 9332 S Chartres Ave
- 885 W Chartres Ave
- 1633 W Rockaway Ln
- 1244 W Michaelsen Way Unit 220
- 1242 W Michaelsen Way
- 1258 W Michaelsen Way S
- 1258 W Michaelsen Way S Unit 220
- 1228 W Michaelsen Way Unit 218
- 1228 W Michaelsen Way
- 1268 W Michaelsen Way
- 1247 W Michaelsen Way Unit 204
- 1247 W Michaelsen Way
- 1233 W Michaelsen Way
- 1249 W Michaelsen Way S Unit 203
- 1261 W Michaelsen Way
- 1214 W Michaelsen Way
- 1214 W Michaelsen Way
- 1214 W Michaelsen Way Unit 217
- 9071 S 1300 W Unit 205
- 9071 S 1300 W
- 1252 W Trimble Ln
- 1252 Trimble Ln
- 9089 S 1300 W Unit 3