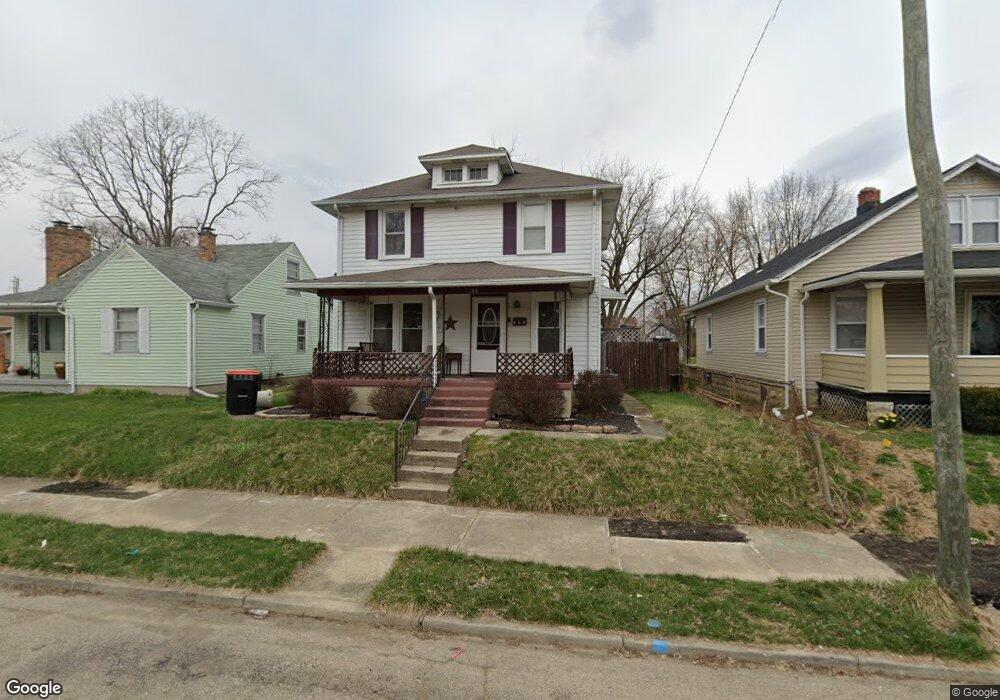
1244 W Mulberry St Springfield, OH 45506
Estimated Value: $74,000 - $123,000
3
Beds
1
Bath
1,280
Sq Ft
$74/Sq Ft
Est. Value
About This Home
This home is located at 1244 W Mulberry St, Springfield, OH 45506 and is currently estimated at $94,811, approximately $74 per square foot. 1244 W Mulberry St is a home located in Clark County with nearby schools including Fulton Elementary School, Hayward Middle School, and Springfield High School.
Ownership History
Date
Name
Owned For
Owner Type
Purchase Details
Closed on
May 1, 2013
Sold by
The Secretary Of Hud
Bought by
Johnson Hiram
Current Estimated Value
Purchase Details
Closed on
Feb 26, 2013
Sold by
Hsbc Bank Usa Na
Bought by
Secretary Of Hud
Purchase Details
Closed on
Jan 22, 2013
Sold by
Emmons Jason M
Bought by
Hsbc Bank Usa Na
Purchase Details
Closed on
Jul 19, 2005
Sold by
Emmons Jason M
Bought by
Emmons Jason M and Bowshier Kerry L
Purchase Details
Closed on
Nov 5, 1997
Sold by
Boggs Scott W
Bought by
Emmons Jason M
Home Financials for this Owner
Home Financials are based on the most recent Mortgage that was taken out on this home.
Original Mortgage
$43,302
Interest Rate
7.42%
Mortgage Type
FHA
Create a Home Valuation Report for This Property
The Home Valuation Report is an in-depth analysis detailing your home's value as well as a comparison with similar homes in the area
Home Values in the Area
Average Home Value in this Area
Purchase History
| Date | Buyer | Sale Price | Title Company |
|---|---|---|---|
| Johnson Hiram | -- | None Available | |
| Secretary Of Hud | -- | None Available | |
| Hsbc Bank Usa Na | $26,667 | None Available | |
| Emmons Jason M | -- | -- | |
| Emmons Jason M | $42,900 | -- |
Source: Public Records
Mortgage History
| Date | Status | Borrower | Loan Amount |
|---|---|---|---|
| Previous Owner | Emmons Jason M | $43,302 |
Source: Public Records
Tax History Compared to Growth
Tax History
| Year | Tax Paid | Tax Assessment Tax Assessment Total Assessment is a certain percentage of the fair market value that is determined by local assessors to be the total taxable value of land and additions on the property. | Land | Improvement |
|---|---|---|---|---|
| 2024 | $737 | $15,300 | $2,080 | $13,220 |
| 2023 | $1,160 | $15,300 | $2,080 | $13,220 |
| 2022 | $1,648 | $15,300 | $2,080 | $13,220 |
| 2021 | $765 | $14,310 | $1,950 | $12,360 |
| 2020 | $767 | $14,310 | $1,950 | $12,360 |
| 2019 | $769 | $14,310 | $1,950 | $12,360 |
| 2018 | $777 | $13,890 | $1,620 | $12,270 |
| 2017 | $776 | $13,899 | $1,624 | $12,275 |
| 2016 | $777 | $13,899 | $1,624 | $12,275 |
| 2015 | $793 | $13,899 | $1,624 | $12,275 |
| 2014 | $789 | $13,899 | $1,624 | $12,275 |
| 2013 | $922 | $13,899 | $1,624 | $12,275 |
Source: Public Records
Map
Nearby Homes
- 1205 W High St
- 1009 W High St
- 833 W Mulberry St
- 1120 W High St
- 22 Seever St
- 1201 Dibert Ave
- 0 Montgomery Ave
- 101`103 N Western
- 1420 Parker Ct
- 40 Zischler St
- 830 Dibert Ave
- 1824 W Washington St
- 935 W North St Unit 935
- 1216 Innisfallen Ave
- 1715 W North St
- 929 S Western Ave
- 366 N Isabella St
- 1109 Montgomery Ave
- 516 W Clark St
- 642 W Euclid Ave
- 1236 W Mulberry St
- 1306 W Mulberry St
- 1234 W Mulberry St
- 1232 W Mulberry St
- 1230 W Mulberry St
- 320 Montgomery Ave
- 326 Montgomery Ave
- 1241 W Jefferson St
- 1224 W Mulberry St
- 1243 W Mulberry St
- 1227 W Jefferson St
- 1245 W Mulberry St
- 1237 W Mulberry St
- 1303 W Mulberry St
- 336 Montgomery Ave
- 1235 W Mulberry St
- 1305 W Mulberry St
- 1225 W Jefferson St
- 1227 W Mulberry St
- 1222 W Mulberry St