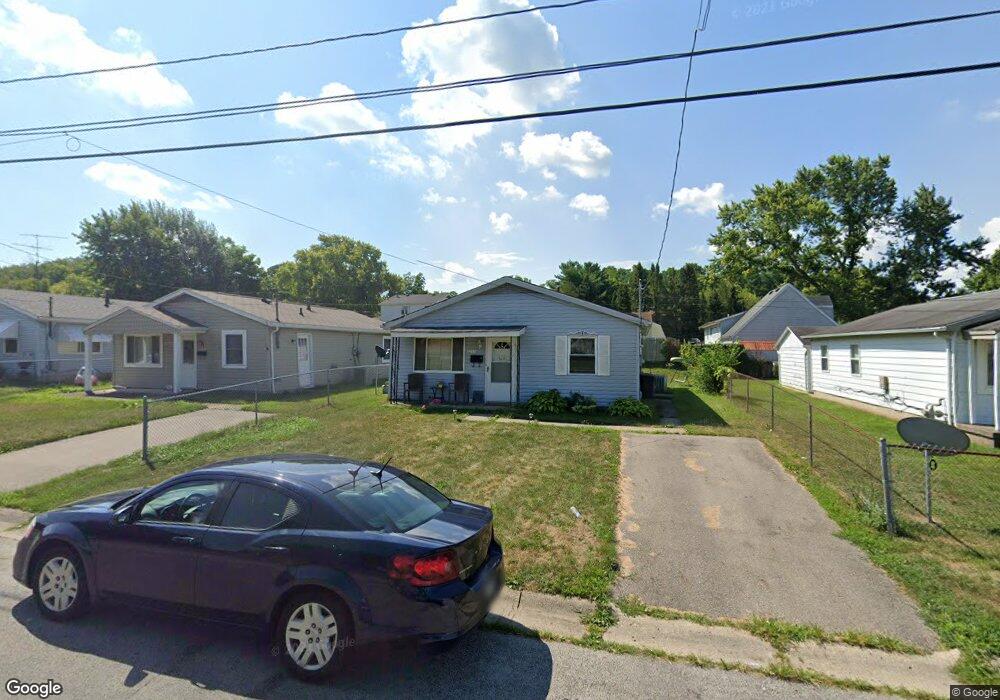
1245 Albemarle Rd Springfield, OH 45504
Estimated Value: $99,557 - $130,000
3
Beds
1
Bath
936
Sq Ft
$129/Sq Ft
Est. Value
About This Home
This home is located at 1245 Albemarle Rd, Springfield, OH 45504 and is currently estimated at $121,139, approximately $129 per square foot. 1245 Albemarle Rd is a home located in Clark County with nearby schools including Snyder Park Elementary School, Roosevelt Middle School, and Springfield High School.
Ownership History
Date
Name
Owned For
Owner Type
Purchase Details
Closed on
Apr 9, 2025
Sold by
Williams Perry Kent and Williams Karen A
Bought by
Pkw Williams Llc
Current Estimated Value
Purchase Details
Closed on
Jan 8, 2007
Sold by
Williams Richard H
Bought by
Williams Perry K and Williams Phyllis K
Purchase Details
Closed on
Sep 4, 2003
Sold by
U S Bank Na
Bought by
Williams Richard H and Williams Perry Kent
Purchase Details
Closed on
May 28, 2003
Sold by
Mcglothen Mary A
Bought by
U S Bank Na and Eqcc Home Equity Loan Trust 1999-3
Purchase Details
Closed on
Jul 7, 1994
Sold by
Krauss Anna M D
Bought by
Mcglothen Mary A
Home Financials for this Owner
Home Financials are based on the most recent Mortgage that was taken out on this home.
Original Mortgage
$33,500
Interest Rate
8.61%
Mortgage Type
New Conventional
Create a Home Valuation Report for This Property
The Home Valuation Report is an in-depth analysis detailing your home's value as well as a comparison with similar homes in the area
Home Values in the Area
Average Home Value in this Area
Purchase History
| Date | Buyer | Sale Price | Title Company |
|---|---|---|---|
| Pkw Williams Llc | -- | None Listed On Document | |
| Pkw Williams Llc | -- | None Listed On Document | |
| Williams Perry K | -- | None Available | |
| Williams Richard H | $30,000 | Accutitle Agency Inc | |
| U S Bank Na | $28,000 | Accutitle Agency Inc | |
| Mcglothen Mary A | $32,500 | -- |
Source: Public Records
Mortgage History
| Date | Status | Borrower | Loan Amount |
|---|---|---|---|
| Previous Owner | Mcglothen Mary A | $33,500 |
Source: Public Records
Tax History
| Year | Tax Paid | Tax Assessment Tax Assessment Total Assessment is a certain percentage of the fair market value that is determined by local assessors to be the total taxable value of land and additions on the property. | Land | Improvement |
|---|---|---|---|---|
| 2025 | $596 | $19,330 | $2,900 | $16,430 |
| 2024 | $580 | $11,750 | $2,070 | $9,680 |
| 2023 | $580 | $11,750 | $2,070 | $9,680 |
| 2022 | $595 | $11,750 | $2,070 | $9,680 |
| 2021 | $646 | $11,750 | $2,070 | $9,680 |
| 2020 | $647 | $11,750 | $2,070 | $9,680 |
| 2019 | $649 | $11,750 | $2,070 | $9,680 |
| 2018 | $636 | $11,050 | $2,070 | $8,980 |
| 2017 | $635 | $11,050 | $2,072 | $8,978 |
| 2016 | $636 | $11,050 | $2,072 | $8,978 |
| 2015 | $649 | $11,050 | $2,072 | $8,978 |
| 2014 | $646 | $11,050 | $2,072 | $8,978 |
| 2013 | $639 | $11,050 | $2,072 | $8,978 |
Source: Public Records
Map
Nearby Homes
- 1224 Beverly Ave
- 1015 Hillcrest Ave
- 1329 Lamar Dr
- 827 Snowhill Blvd
- 820 W 1st St
- 1425 Sheaff Rd
- 735 Tanglewood Dr
- 648 N Tanglewood Dr
- 412 Dakota Ave
- 366 N Isabella St
- 423 N Jackson St Unit 425
- 306 N Bechtle Ave
- 263 N Isabella St Unit 265
- 207 N Bechtle Ave Unit 209
- 1524 W North St Unit 1526
- 239 N Shaffer St
- 820 W North St
- 1420 Parker Ct
- 1866 Maiden Ln
- 101`103 N Western
- 1241 Albemarle Rd
- 1249 Albemarle Rd
- 1237 Albemarle Rd
- 1206 Goodwin Ave
- 1234 Beverly Ave
- 1301 Albemarle Rd
- 1230 Beverly Ave
- 1227 Albemarle Rd
- 1226 Beverly Ave
- 1223 Albemarle Rd
- 1233 W 1st St
- 1300 Goodwin Ave
- 1311 Albemarle Rd
- 1241 W 1st St
- 1239 Beverly Ave
- 1255 Beverly Ave
- 1255 Beverly Ave
- 1219 Albemarle Rd
- 1312 Beverly Ave
- 1218 Beverly Ave
Your Personal Tour Guide
Ask me questions while you tour the home.