Estimated Value: $580,556 - $733,000
4
Beds
3
Baths
2,946
Sq Ft
$213/Sq Ft
Est. Value
About This Home
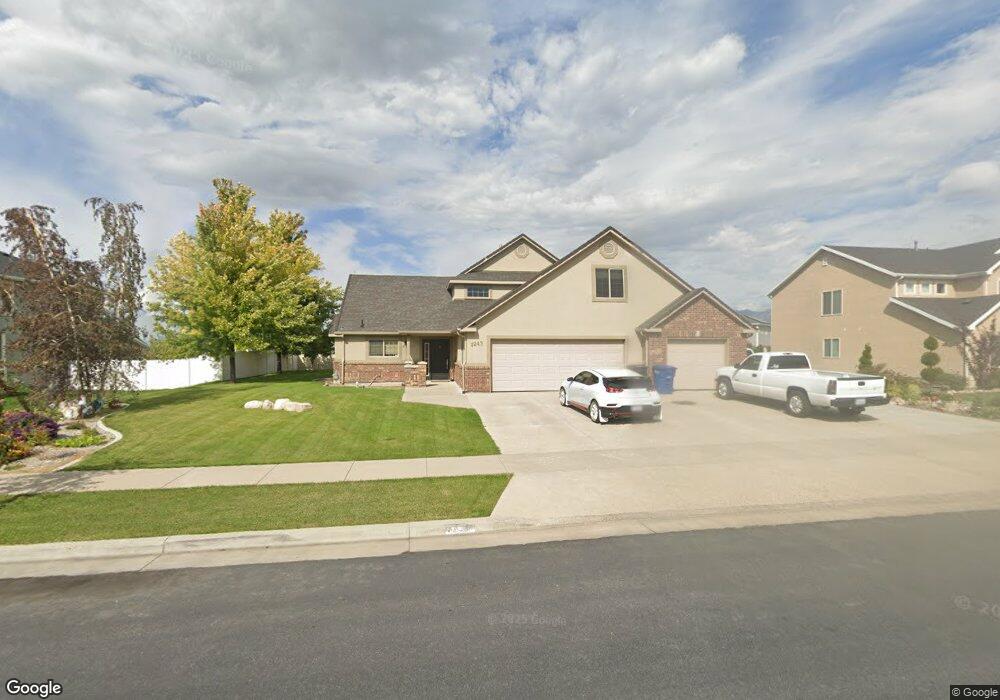
This home is located at 1245 W 2980 S, Logan, UT 84321 and is currently estimated at $626,889, approximately $212 per square foot. 1245 W 2980 S is a home located in Cache County with nearby schools including Heritage School, South Cache Middle School, and Spring Creek Middle School.
Ownership History
Date
Name
Owned For
Owner Type
Purchase Details
Closed on
Aug 1, 2012
Sold by
Larsen Benjamin and Larsen Jamie
Bought by
Bassett Tony W and Bassett Laura Kimberly
Current Estimated Value
Home Financials for this Owner
Home Financials are based on the most recent Mortgage that was taken out on this home.
Original Mortgage
$220,924
Outstanding Balance
$151,155
Interest Rate
3.56%
Mortgage Type
FHA
Estimated Equity
$475,734
Purchase Details
Closed on
May 23, 2008
Sold by
Larsen Steve
Bought by
Larsen Benjamin and Larsen Jamie
Home Financials for this Owner
Home Financials are based on the most recent Mortgage that was taken out on this home.
Original Mortgage
$254,511
Interest Rate
5.88%
Mortgage Type
FHA
Purchase Details
Closed on
Jun 1, 2007
Sold by
Anderson Neil L
Bought by
Larsen Steve
Home Financials for this Owner
Home Financials are based on the most recent Mortgage that was taken out on this home.
Original Mortgage
$187,500
Interest Rate
6.12%
Mortgage Type
Credit Line Revolving
Create a Home Valuation Report for This Property
The Home Valuation Report is an in-depth analysis detailing your home's value as well as a comparison with similar homes in the area
Home Values in the Area
Average Home Value in this Area
Purchase History
| Date | Buyer | Sale Price | Title Company |
|---|---|---|---|
| Bassett Tony W | -- | Advanced Title | |
| Larsen Benjamin | -- | Pinnacle Title Ins Agency | |
| Larsen Steve | -- | Pinnacle Title Ins Agency |
Source: Public Records
Mortgage History
| Date | Status | Borrower | Loan Amount |
|---|---|---|---|
| Open | Bassett Tony W | $220,924 | |
| Previous Owner | Larsen Benjamin | $254,511 | |
| Previous Owner | Larsen Steve | $187,500 |
Source: Public Records
Tax History Compared to Growth
Tax History
| Year | Tax Paid | Tax Assessment Tax Assessment Total Assessment is a certain percentage of the fair market value that is determined by local assessors to be the total taxable value of land and additions on the property. | Land | Improvement |
|---|---|---|---|---|
| 2025 | $2,529 | $335,195 | $0 | $0 |
| 2024 | $2,698 | $335,815 | $0 | $0 |
| 2023 | $2,831 | $329,890 | $0 | $0 |
| 2022 | $2,947 | $329,890 | $0 | $0 |
| 2021 | $2,280 | $396,473 | $65,000 | $331,473 |
| 2020 | $2,134 | $353,238 | $65,000 | $288,238 |
| 2019 | $2,238 | $353,237 | $65,000 | $288,237 |
| 2018 | $1,964 | $302,355 | $45,000 | $257,355 |
| 2017 | $1,956 | $159,555 | $0 | $0 |
| 2016 | $1,978 | $131,185 | $0 | $0 |
| 2015 | $1,616 | $131,185 | $0 | $0 |
| 2014 | $1,565 | $131,185 | $0 | $0 |
| 2013 | -- | $132,175 | $0 | $0 |
Source: Public Records
Map
Nearby Homes
- 1231 Nibley Pkwy Unit 29
- 1231 Nibley Pkwy
- 1231 W 2980 S Unit 29
- 1231 Nibley Pkwy Unit 29
- 1261 W 2980 S Unit 31
- 1261 Nibley Pkwy Unit 31
- 1261 Nibley Pkwy Unit 31
- 1261 W 2980 S Unit 31
- 1202 W 2890 S Unit 39
- 1202 W 2890 S
- 1212 W 2890 S Unit 38
- 1212 W 2890 S
- 1217 W 2980 S
- 1246 W 2980 S Unit 25
- 1246 Nibley Pkwy
- 1246 Nibley Pkwy Unit 25
- 1279 W 2980 S Unit 32
- 1256 Nibley Pkwy Unit 24
- 1256 Nibley Pkwy
- 1256 W 2980 S Unit 24