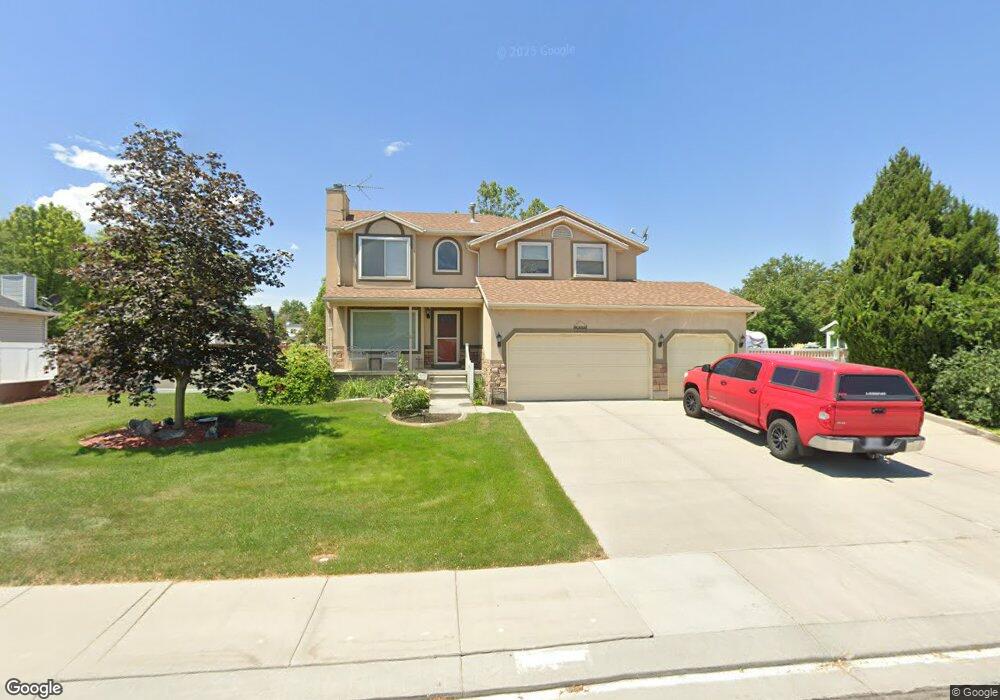
12450 Red Elm Way Riverton, UT 84065
Estimated Value: $701,043 - $774,000
5
Beds
3
Baths
2,736
Sq Ft
$268/Sq Ft
Est. Value
About This Home
This home is located at 12450 Red Elm Way, Riverton, UT 84065 and is currently estimated at $732,761, approximately $267 per square foot. 12450 Red Elm Way is a home located in Salt Lake County with nearby schools including Southland Elementary School, Oquirrh Hills Middle School, and Riverton High School.
Ownership History
Date
Name
Owned For
Owner Type
Purchase Details
Closed on
Sep 23, 2005
Sold by
Ward Diane R
Bought by
Jackson Paul W and Jackson Diane
Current Estimated Value
Purchase Details
Closed on
Jul 27, 2001
Sold by
Hensel Richard B and Hensel Kathy
Bought by
Ward S Gene and Ward Diane R
Home Financials for this Owner
Home Financials are based on the most recent Mortgage that was taken out on this home.
Original Mortgage
$130,000
Interest Rate
7.15%
Purchase Details
Closed on
Jun 24, 1999
Sold by
Johnson Bruce R and Johnson Claudette
Bought by
Hensel Richard B and Hensel Kathy
Home Financials for this Owner
Home Financials are based on the most recent Mortgage that was taken out on this home.
Original Mortgage
$192,350
Interest Rate
7.75%
Purchase Details
Closed on
Apr 7, 1994
Sold by
Glen Pettit Inc
Bought by
Johnson Bruce R and Johnson Claudette
Create a Home Valuation Report for This Property
The Home Valuation Report is an in-depth analysis detailing your home's value as well as a comparison with similar homes in the area
Home Values in the Area
Average Home Value in this Area
Purchase History
| Date | Buyer | Sale Price | Title Company |
|---|---|---|---|
| Jackson Paul W | -- | None Available | |
| Ward S Gene | -- | Surety Title | |
| Hensel Richard B | -- | First American Title | |
| Johnson Bruce R | -- | -- | |
| Glen Pettit Inc | -- | -- |
Source: Public Records
Mortgage History
| Date | Status | Borrower | Loan Amount |
|---|---|---|---|
| Previous Owner | Ward S Gene | $130,000 | |
| Previous Owner | Hensel Richard B | $192,350 |
Source: Public Records
Tax History Compared to Growth
Tax History
| Year | Tax Paid | Tax Assessment Tax Assessment Total Assessment is a certain percentage of the fair market value that is determined by local assessors to be the total taxable value of land and additions on the property. | Land | Improvement |
|---|---|---|---|---|
| 2025 | $33 | $645,100 | $287,700 | $357,400 |
| 2024 | $33 | $628,800 | $261,100 | $367,700 |
| 2023 | $3,824 | $624,000 | $258,500 | $365,500 |
| 2022 | $3,777 | $604,500 | $253,500 | $351,000 |
| 2021 | $3,199 | $455,900 | $164,400 | $291,500 |
| 2020 | $3,093 | $411,000 | $164,400 | $246,600 |
| 2019 | $3,077 | $402,000 | $164,400 | $237,600 |
| 2018 | $0 | $365,900 | $153,400 | $212,500 |
| 2017 | $2,559 | $320,700 | $153,400 | $167,300 |
| 2016 | $2,702 | $324,900 | $153,400 | $171,500 |
| 2015 | $2,469 | $287,900 | $152,000 | $135,900 |
| 2014 | $2,368 | $270,700 | $144,700 | $126,000 |
Source: Public Records
Map
Nearby Homes
- 12580 S Janice Dr
- 2853 W 12075 S
- 12501 Falls Creek Rd
- 12658 Old Fort Cir
- 12906 Verona Creek Way
- 12191 S 3600 W
- 2356 W Montcalm Dr
- 3277 W 13120 S
- 3168 Chalk Creek Way
- 3644 W Harvest Gold Way
- 11881 S Harvest Gold Way
- 3636 W Harvest Gold Way
- 3622 W Harvest Gold Way
- 12900 S 2200 W
- 11716 S 2610 W
- 3376 W Water Crescent Place
- 2511 W 11730 S
- 13283 S Lucky Dog Ln
- 3371 W Waterbridge Cove Unit 417
- 11817 S 3700 W
- 12466 Red Elm Way
- 12434 S Red Elm Way
- 12434 S Red Elm Way
- 12416 Red Elm Way
- 12482 Red Elm Way
- 12449 Elm Meadows Rd
- 12449 S Elm Meadows Rd
- 12437 Elm Meadows Rd
- 12463 Elm Meadows Rd
- 12449 Red Elm Way
- 12449 S Red Elm Way
- 12449 S 3145 W
- 12465 Red Elm Way
- 12465 S Red Elm Way
- 12436 Red Elm Way
- 12425 Elm Meadows Rd
- 12477 Elm Meadows Rd
- 3066 Red Elm Way
- 3066 W Red Elm Way
- 3098 W Red Elm Way