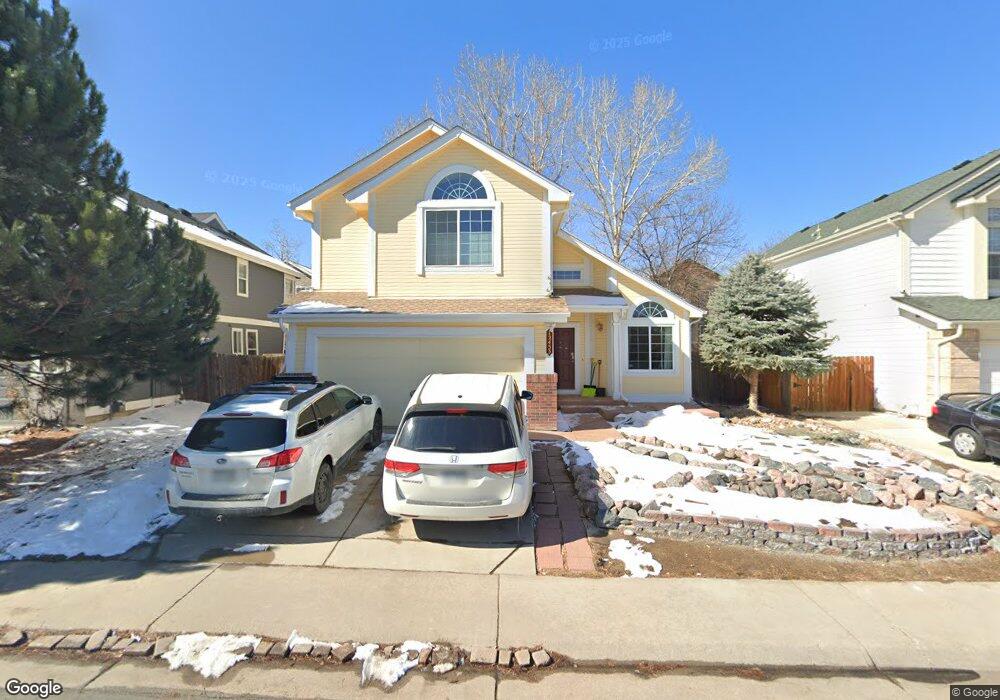
12453 Forest View St Broomfield, CO 80020
Brandywine NeighborhoodEstimated Value: $571,186 - $628,000
3
Beds
3
Baths
1,504
Sq Ft
$397/Sq Ft
Est. Value
About This Home
This home is located at 12453 Forest View St, Broomfield, CO 80020 and is currently estimated at $597,297, approximately $397 per square foot. 12453 Forest View St is a home located in Broomfield County with nearby schools including Mountain View Elementary School, Westlake Middle School, and Legacy High School.
Ownership History
Date
Name
Owned For
Owner Type
Purchase Details
Closed on
Feb 24, 2006
Sold by
Thomson Pauline C
Bought by
Malm Andrew I R and Malm Jennifer S
Current Estimated Value
Home Financials for this Owner
Home Financials are based on the most recent Mortgage that was taken out on this home.
Original Mortgage
$188,000
Outstanding Balance
$105,747
Interest Rate
6.09%
Mortgage Type
Fannie Mae Freddie Mac
Estimated Equity
$491,550
Purchase Details
Closed on
Sep 16, 2002
Sold by
Thomson Paul A and Thomson Paul Andrew
Bought by
Thomson Paul A and Thomson Pauline C
Home Financials for this Owner
Home Financials are based on the most recent Mortgage that was taken out on this home.
Original Mortgage
$156,200
Interest Rate
6.25%
Purchase Details
Closed on
Jul 15, 1999
Sold by
Thomson M Angela Aka Mary Ange
Bought by
Thomson Paul A Aka
Purchase Details
Closed on
Nov 24, 1995
Purchase Details
Closed on
Apr 5, 1994
Purchase Details
Closed on
Dec 8, 1993
Create a Home Valuation Report for This Property
The Home Valuation Report is an in-depth analysis detailing your home's value as well as a comparison with similar homes in the area
Home Values in the Area
Average Home Value in this Area
Purchase History
| Date | Buyer | Sale Price | Title Company |
|---|---|---|---|
| Malm Andrew I R | $235,000 | Guardian Title | |
| Thomson Paul A | -- | -- | |
| Thomson Paul A Aka | -- | -- | |
| -- | -- | -- | |
| -- | $133,000 | -- | |
| -- | $18,500 | -- |
Source: Public Records
Mortgage History
| Date | Status | Borrower | Loan Amount |
|---|---|---|---|
| Open | Malm Andrew I R | $188,000 | |
| Previous Owner | Thomson Paul A | $156,200 |
Source: Public Records
Tax History Compared to Growth
Tax History
| Year | Tax Paid | Tax Assessment Tax Assessment Total Assessment is a certain percentage of the fair market value that is determined by local assessors to be the total taxable value of land and additions on the property. | Land | Improvement |
|---|---|---|---|---|
| 2025 | $3,790 | $36,800 | $9,050 | $27,750 |
| 2024 | $3,790 | $35,340 | $8,190 | $27,150 |
| 2023 | $3,755 | $40,480 | $9,380 | $31,100 |
| 2022 | $3,127 | $27,680 | $6,600 | $21,080 |
| 2021 | $3,225 | $28,480 | $6,790 | $21,690 |
| 2020 | $3,096 | $27,050 | $6,440 | $20,610 |
| 2019 | $3,098 | $27,240 | $6,480 | $20,760 |
| 2018 | $2,722 | $23,080 | $4,680 | $18,400 |
| 2017 | $2,480 | $25,510 | $5,170 | $20,340 |
| 2016 | $2,328 | $21,110 | $5,050 | $16,060 |
| 2015 | $2,327 | $17,410 | $5,050 | $12,360 |
| 2014 | $1,972 | $17,410 | $5,050 | $12,360 |
Source: Public Records
Map
Nearby Homes
- 12450 Forest View St
- 12545 Tammywood St
- 12205 Pery St
- 12620 Winona Ct
- 12510 Newton St
- 12695 Wolff St
- 12217 Crabapple St
- 12205 Perry St Unit 17
- 12205 Perry St Unit 259
- 12205 Perry St Unit 167
- 12205 Perry St Unit 67
- 12205 Perry St Unit 287
- 3974 Cambridge Ave
- 3981 W 127th Ave
- 5005 W 128th Place
- 5143 Yates Place
- 12528 James Point
- 3465 W 125th Point
- 12420 James St
- 3414 W 126th Place
- 12467 Forest View St
- 12435 Forest View St
- 12454 Abbey St
- 12438 Abbey St
- 12466 Abbey St
- 12471 Forest View St
- 12421 Forest View St
- 12426 Forest View St
- 12426 Abbey St
- 12470 Abbey St
- 12472 Forest View St
- 12417 Forest View St
- 12410 Abbey St
- 12434 Forest View St
- 4281 Hawthorne Dr
- 12468 Forest View St
- 12457 Abbey St
- 12445 Abbey St
- 12469 Abbey St
- 4279 Hawthorne Dr