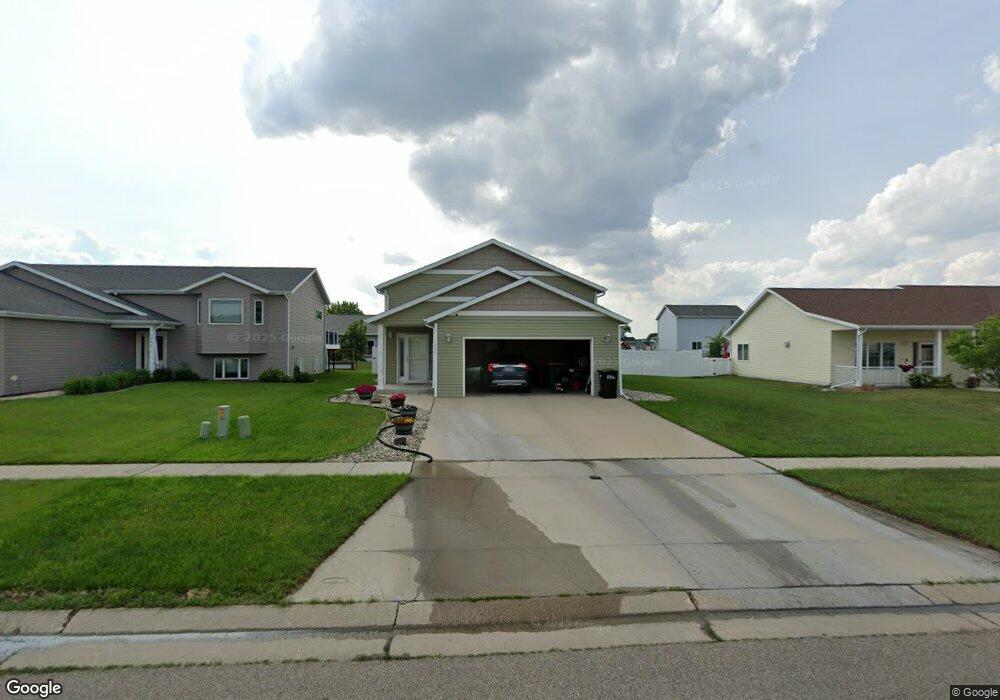
1246 4th St NW West Fargo, ND 58078
Goldenwood NeighborhoodEstimated Value: $289,000 - $344,936
3
Beds
2
Baths
1,842
Sq Ft
$172/Sq Ft
Est. Value
About This Home
This home is located at 1246 4th St NW, West Fargo, ND 58078 and is currently estimated at $316,968, approximately $172 per square foot. 1246 4th St NW is a home located in Cass County with nearby schools including Westside Elementary School, Cheney Middle School, and West Fargo High School.
Ownership History
Date
Name
Owned For
Owner Type
Purchase Details
Closed on
Apr 29, 2024
Sold by
Niemiste Erik
Bought by
Niemiste Michelle and Iverson Michelle
Current Estimated Value
Purchase Details
Closed on
Dec 8, 2017
Sold by
Om Shane Justin and Om Shane
Bought by
Niemiste Erik and Iverson Michelle
Home Financials for this Owner
Home Financials are based on the most recent Mortgage that was taken out on this home.
Original Mortgage
$179,920
Interest Rate
3.94%
Mortgage Type
New Conventional
Purchase Details
Closed on
Dec 1, 2012
Sold by
Malheim Ashley Lynn
Bought by
Ron Shane Justin
Purchase Details
Closed on
Dec 9, 2008
Sold by
Homeland Developers Inc
Bought by
Orn Shane and Orn Ashley
Home Financials for this Owner
Home Financials are based on the most recent Mortgage that was taken out on this home.
Original Mortgage
$126,000
Interest Rate
6.49%
Mortgage Type
New Conventional
Create a Home Valuation Report for This Property
The Home Valuation Report is an in-depth analysis detailing your home's value as well as a comparison with similar homes in the area
Home Values in the Area
Average Home Value in this Area
Purchase History
| Date | Buyer | Sale Price | Title Company |
|---|---|---|---|
| Niemiste Michelle | -- | None Listed On Document | |
| Niemiste Erik | $224,900 | None Available | |
| Ron Shane Justin | -- | None Available | |
| Orn Shane | -- | -- | |
| Homestead Develophers Inc | -- | -- |
Source: Public Records
Mortgage History
| Date | Status | Borrower | Loan Amount |
|---|---|---|---|
| Previous Owner | Niemiste Erik | $179,920 | |
| Previous Owner | Orn Shane | $126,000 |
Source: Public Records
Tax History Compared to Growth
Tax History
| Year | Tax Paid | Tax Assessment Tax Assessment Total Assessment is a certain percentage of the fair market value that is determined by local assessors to be the total taxable value of land and additions on the property. | Land | Improvement |
|---|---|---|---|---|
| 2024 | $3,482 | $126,500 | $25,800 | $100,700 |
| 2023 | $3,922 | $123,350 | $25,800 | $97,550 |
| 2022 | $3,793 | $113,000 | $25,800 | $87,200 |
| 2021 | $3,627 | $103,300 | $16,600 | $86,700 |
| 2020 | $3,632 | $105,550 | $16,600 | $88,950 |
| 2019 | $3,558 | $102,750 | $16,600 | $86,150 |
| 2018 | $4,993 | $104,550 | $16,600 | $87,950 |
| 2017 | $4,728 | $100,150 | $16,600 | $83,550 |
| 2016 | $4,558 | $102,900 | $16,600 | $86,300 |
| 2015 | $4,263 | $82,650 | $15,250 | $67,400 |
| 2014 | $4,078 | $77,250 | $15,250 | $62,000 |
| 2013 | $4,189 | $77,250 | $15,250 | $62,000 |
Source: Public Records
Map
Nearby Homes
- 1247 4th St NW
- 1324 4th St NW
- 541 4th Ave NW
- 52 Pinewood Blvd
- 510 2nd Ave NW
- 51 Center St
- 78 Evergreen Cir
- 36 Evergreen Cir
- 5645 12th Ave NE Unit 10
- 5645 12th Ave NE Unit 9
- 5645 12th Ave NE Unit 8
- 5645 12th Ave NE Unit 3
- 5645 12th Ave NE Unit 4
- 5645 12th Ave NE Unit 2
- 924 10th Ave NE
- 5590 13th Ave N Unit 1
- 121 1st Ave E