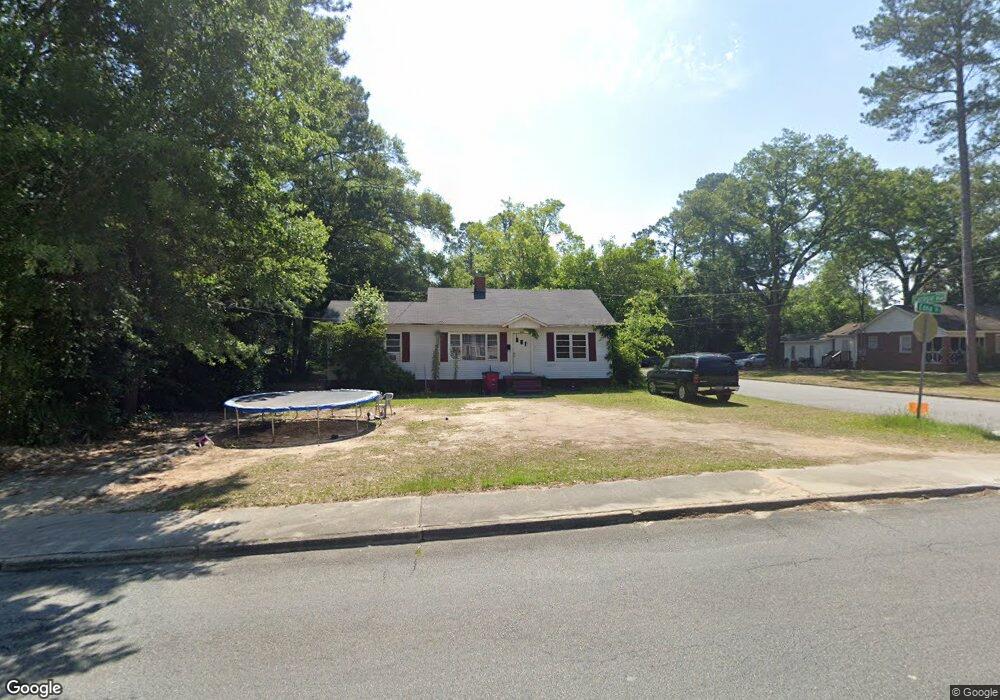
1246 Edna Place Macon, GA 31204
Estimated Value: $72,818 - $110,000
3
Beds
1
Bath
1,078
Sq Ft
$79/Sq Ft
Est. Value
About This Home
This home is located at 1246 Edna Place, Macon, GA 31204 and is currently estimated at $85,205, approximately $79 per square foot. 1246 Edna Place is a home located in Bibb County with nearby schools including John Robert Lewis Elementary School, Weaver Middle School, and Westside High School.
Ownership History
Date
Name
Owned For
Owner Type
Purchase Details
Closed on
Dec 27, 2021
Sold by
Brooks Jr James E
Bought by
Lanier Property Group I Llc
Current Estimated Value
Purchase Details
Closed on
Dec 16, 2021
Sold by
Brooks Jr James E
Bought by
Lanier Property Group I Llc
Purchase Details
Closed on
Aug 2, 2013
Sold by
Payne Lisa Lynn and Lefils Edgar R
Bought by
Brooks James E
Purchase Details
Closed on
Feb 29, 2012
Sold by
Lynn Willie Mae
Bought by
Payne Lisa Lynn and Lefisl Edgar R
Purchase Details
Closed on
Jun 9, 2011
Sold by
Midland Funding Llc
Bought by
Rainey Booby L
Purchase Details
Closed on
Oct 9, 2009
Sold by
Rainey Bobby Lee and Rainey Brenda Ann
Bought by
Lynn Willie Mae
Purchase Details
Closed on
Mar 26, 2001
Sold by
Lynn Willie Mae
Bought by
Rainey Bobby L and Rainey Brenda A
Create a Home Valuation Report for This Property
The Home Valuation Report is an in-depth analysis detailing your home's value as well as a comparison with similar homes in the area
Home Values in the Area
Average Home Value in this Area
Purchase History
| Date | Buyer | Sale Price | Title Company |
|---|---|---|---|
| Lanier Property Group I Llc | $33,460 | C Robin Wyatt Pc | |
| Lanier Property Group I Llc | $33,460 | C Robin Wyatt Pc | |
| Brooks James E | $15,000 | None Available | |
| Payne Lisa Lynn | -- | None Available | |
| Rainey Booby L | $2,500 | None Available | |
| Lynn Willie Mae | -- | None Available | |
| Rainey Bobby L | $45,000 | -- |
Source: Public Records
Mortgage History
| Date | Status | Borrower | Loan Amount |
|---|---|---|---|
| Closed | Lanier Property Group I Llc | $0 |
Source: Public Records
Tax History Compared to Growth
Tax History
| Year | Tax Paid | Tax Assessment Tax Assessment Total Assessment is a certain percentage of the fair market value that is determined by local assessors to be the total taxable value of land and additions on the property. | Land | Improvement |
|---|---|---|---|---|
| 2025 | $657 | $26,738 | $3,038 | $23,700 |
| 2024 | $632 | $24,886 | $3,262 | $21,624 |
| 2023 | $606 | $23,874 | $2,250 | $21,624 |
| 2022 | $457 | $13,202 | $1,586 | $11,616 |
| 2021 | $397 | $10,435 | $1,586 | $8,849 |
| 2020 | $405 | $10,435 | $1,586 | $8,849 |
| 2019 | $408 | $10,435 | $1,586 | $8,849 |
| 2018 | $806 | $10,435 | $1,586 | $8,849 |
| 2017 | $401 | $10,710 | $3,173 | $7,537 |
| 2016 | $380 | $10,985 | $4,442 | $6,543 |
| 2015 | $631 | $10,985 | $4,442 | $6,543 |
| 2014 | $338 | $19,632 | $4,442 | $15,190 |
Source: Public Records
Map
Nearby Homes
- 1246 Edna Place Unit F
- 1230 Edna Place
- 1265 Cypress Dr
- 1252 Edna Place
- 1243 Edna Place
- 1255 Cypress Dr
- 1226 Edna Place
- 1264 Carlisle Ave
- 1237 Edna Place
- 1262 Edna Place
- 1231 Edna Place
- 1245 Cypress Dr
- 3367 Hallwood Cir
- 3361 Hallwood Cir
- 1225 Edna Place
- 1251 Edna Place
- 1220 Edna Place
- 1235 Cypress Dr
- 1219 Edna Place
- 3369 Hallwood Cir