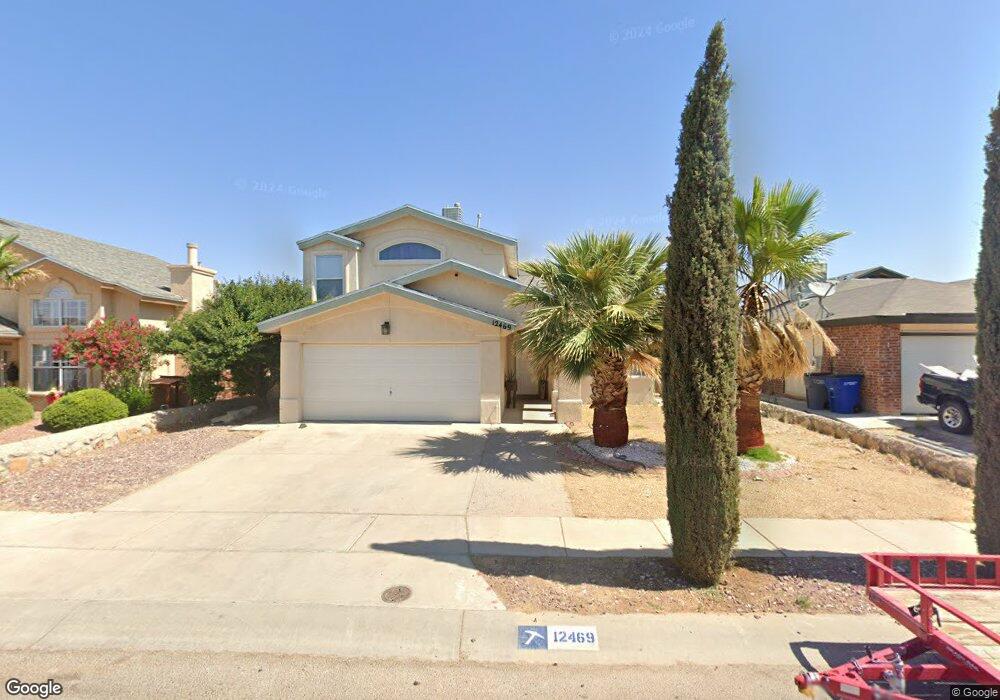
12469 Tierra Laurel Dr Unit 1 El Paso, TX 79938
Estimated Value: $228,000 - $256,000
3
Beds
3
Baths
1,700
Sq Ft
$142/Sq Ft
Est. Value
About This Home
This home is located at 12469 Tierra Laurel Dr Unit 1, El Paso, TX 79938 and is currently estimated at $241,052, approximately $141 per square foot. 12469 Tierra Laurel Dr Unit 1 is a home located in El Paso County with nearby schools including Paso Del Norte School, Special Rafael Hernando Middle School, and El Dorado High School.
Ownership History
Date
Name
Owned For
Owner Type
Purchase Details
Closed on
Aug 2, 2018
Sold by
Cruz Amonio De La and Cruz Monina De La
Bought by
Orozco Carlos Marquez
Current Estimated Value
Home Financials for this Owner
Home Financials are based on the most recent Mortgage that was taken out on this home.
Original Mortgage
$141,391
Outstanding Balance
$124,410
Interest Rate
5.12%
Mortgage Type
FHA
Estimated Equity
$116,642
Purchase Details
Closed on
Mar 11, 2013
Sold by
Sifuentes David A and Sifuentes Idalia
Bought by
Delacruz Antonio
Purchase Details
Closed on
Oct 27, 2004
Sold by
Desert View Construction Inc
Bought by
Sifuentes David A and Sifuentes Idalia
Home Financials for this Owner
Home Financials are based on the most recent Mortgage that was taken out on this home.
Original Mortgage
$103,300
Interest Rate
5.73%
Mortgage Type
FHA
Create a Home Valuation Report for This Property
The Home Valuation Report is an in-depth analysis detailing your home's value as well as a comparison with similar homes in the area
Home Values in the Area
Average Home Value in this Area
Purchase History
| Date | Buyer | Sale Price | Title Company |
|---|---|---|---|
| Orozco Carlos Marquez | -- | None Available | |
| Delacruz Antonio | -- | None Available | |
| Sifuentes David A | -- | -- |
Source: Public Records
Mortgage History
| Date | Status | Borrower | Loan Amount |
|---|---|---|---|
| Open | Orozco Carlos Marquez | $141,391 | |
| Previous Owner | Sifuentes David A | $103,300 |
Source: Public Records
Tax History Compared to Growth
Tax History
| Year | Tax Paid | Tax Assessment Tax Assessment Total Assessment is a certain percentage of the fair market value that is determined by local assessors to be the total taxable value of land and additions on the property. | Land | Improvement |
|---|---|---|---|---|
| 2025 | $4,202 | $229,033 | -- | -- |
| 2024 | $4,202 | $206,715 | -- | -- |
| 2023 | $4,096 | $187,923 | $0 | $0 |
| 2022 | $4,948 | $170,839 | $0 | $0 |
| 2021 | $4,888 | $155,308 | $27,357 | $127,951 |
| 2020 | $4,701 | $148,102 | $27,357 | $120,745 |
| 2018 | $3,902 | $133,411 | $27,357 | $106,054 |
| 2017 | $3,821 | $133,782 | $27,357 | $106,425 |
| 2016 | $3,821 | $133,782 | $27,357 | $106,425 |
| 2015 | $3,715 | $133,782 | $27,357 | $106,425 |
| 2014 | $3,715 | $133,821 | $27,357 | $106,464 |
Source: Public Records
Map
Nearby Homes
- TBD Tierra Este Rd
- 12421 Tierra Encino Dr
- 12644 Tierra Gema Ct
- 3144 Tierra Cuervo Dr
- 12649 Tierra Clara Rd
- 12301 Tierra Limpia Dr
- 12437 Tierra Sauz Dr
- 12625 Tierra Fresca Ct
- 3048 Tierra Nora
- 12709 Tierra Lily Ct
- 12372 Tierra Apache Dr
- 3052 Tierra Valle Dr
- 3644 Tierra Inca Dr
- 12720 Tierra Monje
- 3073 Tierra Salada Dr
- 12278 Tierra Bella Dr
- 12728 Tierra Pueblo
- 12232 Tierra Rosa Way
- 12377 Tierra Alaska Ave
- 3328 Tierra Fertil Dr
- 12469 Tierra Laurel Dr
- 12473 Tierra Laurel Dr
- 12465 Tierra Laurel Dr
- 12468 Tierra Cebada Dr
- 12477 Tierra Laurel Dr
- 12461 Tierra Laurel Dr
- 12464 Tierra Cebada Dr
- 12472 Tierra Cebada Dr
- 3217 Tierra Nido Place
- 3216 Tierra Agua Place
- 12476 Tierra Cebada Dr
- 12460 Tierra Cebada Dr
- 12481 Tierra Laurel Dr
- 12480 Tierra Cebada Dr
- 3213 Tierra Nido Place
- 3212 Tierra Agua Place
- 12485 Tierra Laurel Dr
- 12453 Tierra Laurel Dr
- 3209 Tierra Nido Place
- 12452 Tierra Cebada Dr