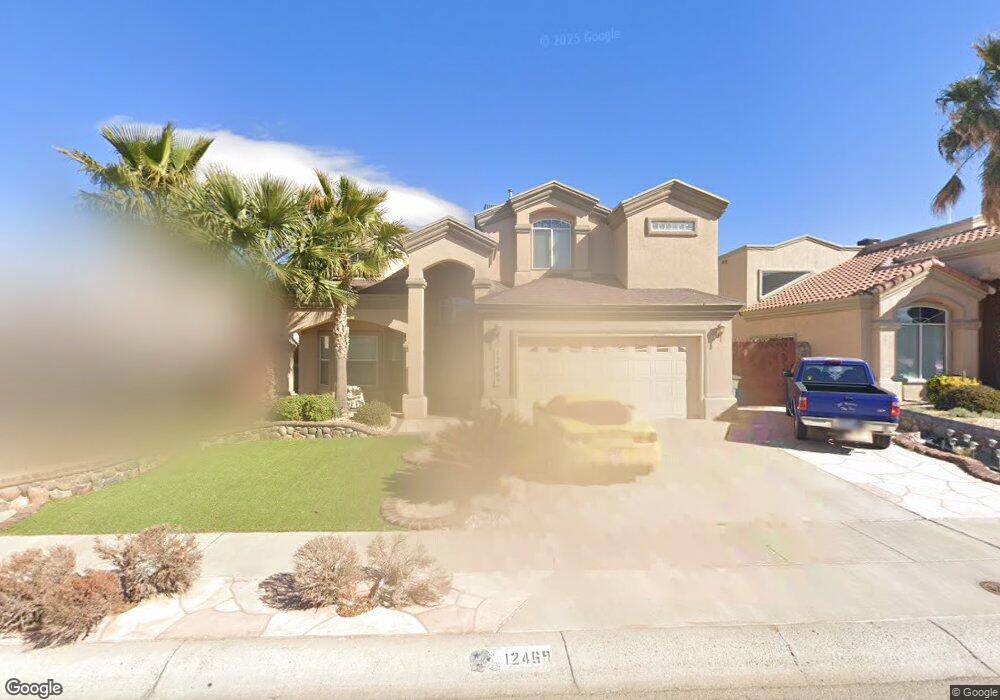
12469 Tierra Limon Dr Unit 7 El Paso, TX 79938
Estimated Value: $345,223 - $361,000
3
Beds
3
Baths
2,300
Sq Ft
$153/Sq Ft
Est. Value
About This Home
This home is located at 12469 Tierra Limon Dr Unit 7, El Paso, TX 79938 and is currently estimated at $351,806, approximately $152 per square foot. 12469 Tierra Limon Dr Unit 7 is a home located in El Paso County with nearby schools including Paso Del Norte School, Special Rafael Hernando Middle School, and El Dorado High School.
Ownership History
Date
Name
Owned For
Owner Type
Purchase Details
Closed on
Oct 19, 2011
Sold by
Arellano Norma and Arellano Martin
Bought by
Hollis Ronald K and Hollis Clara R
Current Estimated Value
Home Financials for this Owner
Home Financials are based on the most recent Mortgage that was taken out on this home.
Original Mortgage
$240,640
Outstanding Balance
$164,442
Interest Rate
4.14%
Mortgage Type
New Conventional
Estimated Equity
$187,364
Purchase Details
Closed on
Jun 27, 2006
Sold by
Martin Kim L and Martin Elizabeth
Bought by
Arellano Norma and Arellano Martin
Purchase Details
Closed on
Nov 7, 2003
Sold by
Fortune Custom Homes Inc
Bought by
Martin Kim L and Martin Elizabeth
Home Financials for this Owner
Home Financials are based on the most recent Mortgage that was taken out on this home.
Original Mortgage
$147,150
Interest Rate
5.81%
Mortgage Type
FHA
Create a Home Valuation Report for This Property
The Home Valuation Report is an in-depth analysis detailing your home's value as well as a comparison with similar homes in the area
Home Values in the Area
Average Home Value in this Area
Purchase History
| Date | Buyer | Sale Price | Title Company |
|---|---|---|---|
| Hollis Ronald K | -- | None Available | |
| Arellano Norma | -- | None Available | |
| Martin Kim L | -- | -- |
Source: Public Records
Mortgage History
| Date | Status | Borrower | Loan Amount |
|---|---|---|---|
| Open | Hollis Ronald K | $240,640 | |
| Previous Owner | Martin Kim L | $147,150 |
Source: Public Records
Tax History Compared to Growth
Tax History
| Year | Tax Paid | Tax Assessment Tax Assessment Total Assessment is a certain percentage of the fair market value that is determined by local assessors to be the total taxable value of land and additions on the property. | Land | Improvement |
|---|---|---|---|---|
| 2025 | $5,599 | $349,946 | -- | -- |
| 2024 | $5,599 | $318,133 | -- | -- |
| 2023 | $5,599 | $289,212 | $0 | $0 |
| 2022 | $7,615 | $262,920 | $0 | $0 |
| 2021 | $7,523 | $259,137 | $33,804 | $225,333 |
| 2020 | $6,897 | $217,289 | $25,112 | $192,177 |
| 2018 | $6,307 | $215,671 | $25,112 | $190,559 |
| 2017 | $5,959 | $208,627 | $25,112 | $183,515 |
| 2016 | $5,959 | $208,627 | $25,112 | $183,515 |
| 2015 | $5,687 | $208,627 | $25,112 | $183,515 |
| 2014 | $5,687 | $213,827 | $25,112 | $188,715 |
Source: Public Records
Map
Nearby Homes
- 12437 Tierra Sauz Dr
- 12421 Tierra Encino Dr
- TBD Tierra Este Rd
- 3144 Tierra Cuervo Dr
- 12644 Tierra Gema Ct
- 3048 Tierra Nora
- 3052 Tierra Valle Dr
- 12301 Tierra Limpia Dr
- 12278 Tierra Bella Dr
- 12720 Tierra Monje
- 12649 Tierra Clara Rd
- 12728 Tierra Pueblo
- 3073 Tierra Salada Dr
- 12709 Tierra Lily Ct
- 2241 Tierra de Oro Way
- 12844 Tierra Pueblo
- 12340 Tierra Humeda Dr
- 12625 Tierra Fresca Ct
- 12905 Tierra Pueblo
- 2337 Jasmine Ali
- 12469 Tierra Limon Dr
- 12473 Tierra Limon Dr
- 12473 Tierra Limon Dr Unit 7
- 12465 Tierra Limon Dr
- 12468 Tierra Encino Dr Unit 7
- 12464 Tierra Encino Dr
- 12464 Tierra Encino Dr Unit 7
- 12461 Tierra Limon Dr
- 12461 Tierra Limon Dr Unit 7
- 12477 Tierra Limon Dr
- 12472 Tierra Encino Dr
- 12460 Tierra Encino Dr
- 12460 Tierra Encino Dr Unit 7
- 12468 Tierra Limon Dr
- 12464 Tierra Limon Dr
- 12464 Tierra Limon Dr Unit 7
- 12464 Tierra Limon Dr Unit 1
- 12476 Tierra Encino Dr
- 12457 Tierra Limon Dr
- 12472 Tierra Limon Dr