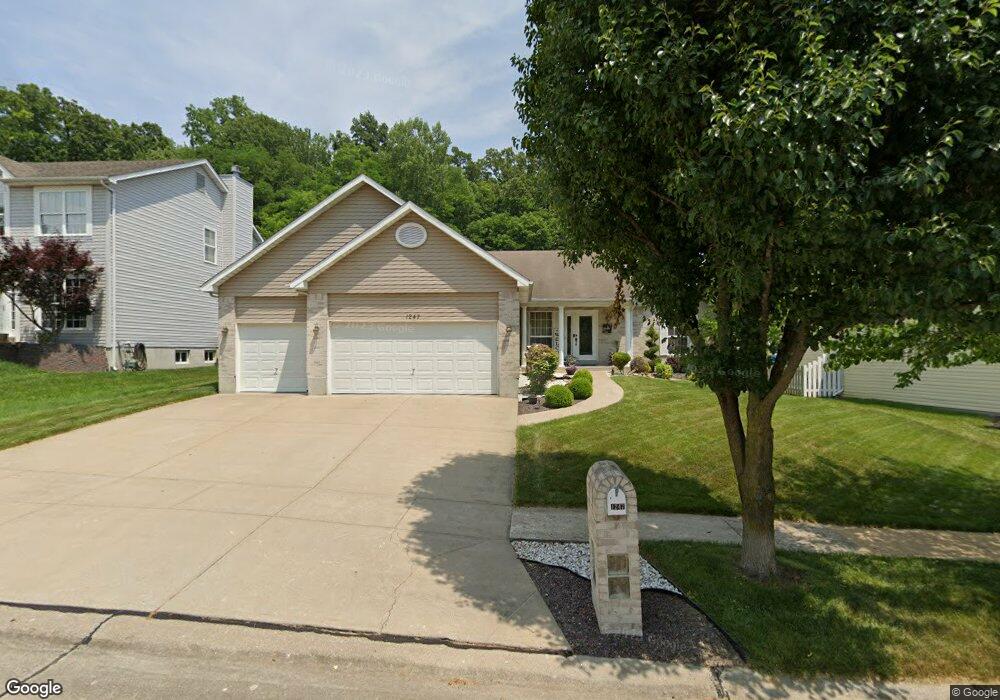
1247 Lake Canyon View Fenton, MO 63026
Estimated Value: $423,000 - $512,000
3
Beds
3
Baths
1,778
Sq Ft
$262/Sq Ft
Est. Value
About This Home
This home is located at 1247 Lake Canyon View, Fenton, MO 63026 and is currently estimated at $466,071, approximately $262 per square foot. 1247 Lake Canyon View is a home located in St. Louis County with nearby schools including Kellison Elementary School, Rockwood South Middle School, and Rockwood Summit Senior High School.
Ownership History
Date
Name
Owned For
Owner Type
Purchase Details
Closed on
Feb 22, 2023
Sold by
Goede Jeffrey K and Goede Rhonda R
Bought by
Jeffrey K Goede And Rhonda R Goede Joint Revo
Current Estimated Value
Purchase Details
Closed on
Oct 30, 2001
Sold by
American Heritage Homes Llc
Bought by
Goede Jeffrey K and Goede Rhonda R
Home Financials for this Owner
Home Financials are based on the most recent Mortgage that was taken out on this home.
Original Mortgage
$222,712
Interest Rate
6.54%
Purchase Details
Closed on
Jul 26, 2001
Sold by
Kaplan Development & Investment Co
Bought by
American Heritage Homes Llc
Home Financials for this Owner
Home Financials are based on the most recent Mortgage that was taken out on this home.
Original Mortgage
$207,609
Interest Rate
7.05%
Mortgage Type
Construction
Create a Home Valuation Report for This Property
The Home Valuation Report is an in-depth analysis detailing your home's value as well as a comparison with similar homes in the area
Home Values in the Area
Average Home Value in this Area
Purchase History
| Date | Buyer | Sale Price | Title Company |
|---|---|---|---|
| Jeffrey K Goede And Rhonda R Goede Joint Revo | -- | -- | |
| Goede Jeffrey K | $247,458 | -- | |
| American Heritage Homes Llc | $77,147 | -- |
Source: Public Records
Mortgage History
| Date | Status | Borrower | Loan Amount |
|---|---|---|---|
| Previous Owner | Goede Jeffrey K | $222,712 | |
| Previous Owner | American Heritage Homes Llc | $207,609 |
Source: Public Records
Tax History Compared to Growth
Tax History
| Year | Tax Paid | Tax Assessment Tax Assessment Total Assessment is a certain percentage of the fair market value that is determined by local assessors to be the total taxable value of land and additions on the property. | Land | Improvement |
|---|---|---|---|---|
| 2025 | $5,474 | $79,360 | $24,320 | $55,040 |
| 2024 | $5,474 | $73,530 | $20,840 | $52,690 |
| 2023 | $5,474 | $73,530 | $20,840 | $52,690 |
| 2022 | $5,082 | $63,650 | $13,030 | $50,620 |
| 2021 | $5,043 | $63,650 | $13,030 | $50,620 |
| 2020 | $5,155 | $62,570 | $12,140 | $50,430 |
| 2019 | $5,170 | $62,570 | $12,140 | $50,430 |
| 2018 | $4,880 | $56,660 | $17,370 | $39,290 |
| 2017 | $4,841 | $56,660 | $17,370 | $39,290 |
| 2016 | $3,795 | $44,790 | $17,370 | $27,420 |
| 2015 | $3,717 | $44,790 | $17,370 | $27,420 |
| 2014 | $3,811 | $44,780 | $3,150 | $41,630 |
Source: Public Records
Map
Nearby Homes
- 1095 Hawkins Rd
- The Westhampton Plan at Oak Ridge Place
- 1218 Feliz Ln
- 1305 Trails Dr
- 108 Cherry Hill Dr
- 1185 Scheel Ln
- 108 E Lark Dr
- 6 Hickory Hollow Ln
- 1222 Perdiz Ln
- 1376 Remington Oaks Terrace
- 1564 Codorniz Ln
- 1401 Windrider Ct
- 315 Richarz Dr
- 4 Dixie Dr
- 18 Cedar Trail Ct
- 1009 Remington Oaks Ct
- 1221 Newport Landing Dr
- 1200 Queens Trail Ln
- 1228 Forest Trails Ct
- 800 Mary Lee Ct
- 1251 Lake Canyon View
- 1243 Lake Canyon View
- 1227 Lake Canyon View
- 1255 Lake Canyon View
- 1219 Lake Canyon View
- 1248 Lake Canyon View
- 1244 Lake Canyon View
- 1252 Lake Canyon View
- 1215 Lake Canyon View
- 1240 Lake Canyon View
- 1256 Lake Canyon View
- 1236 Lake Canyon View
- 1202 Hawkins Rd
- 1211 Lake Canyon View
- 1228 Lake Canyon View
- 1232 Lake Canyon View
- 1224 Lake Canyon View
- 1220 Lake Canyon View
- 1260 Lake Canyon View
- 922 Oak Trail Ct