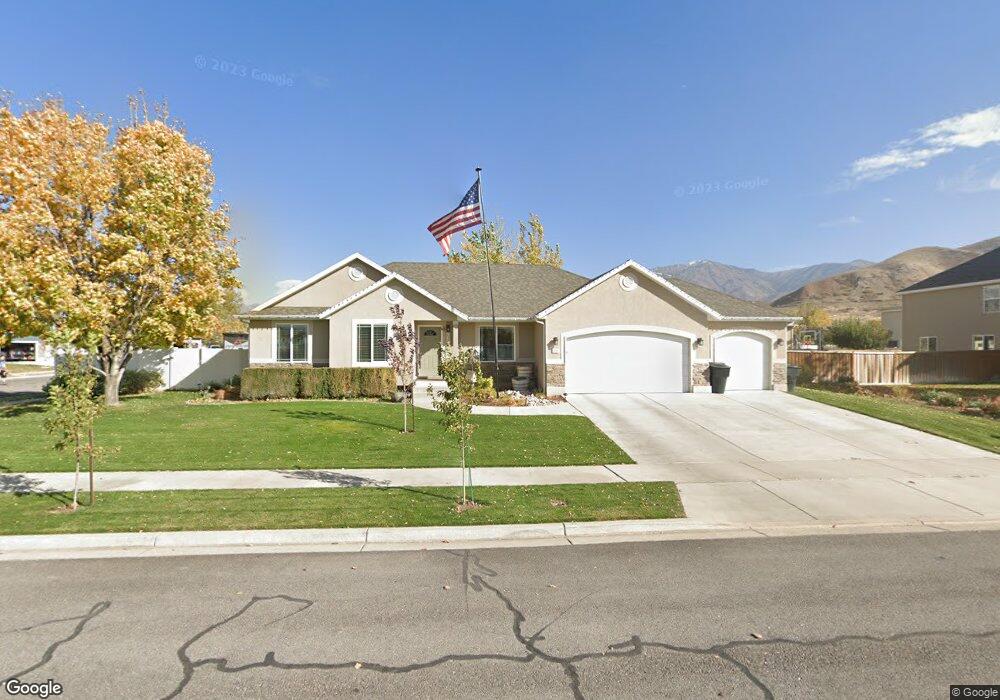
1247 S 300 W Payson, UT 84651
Estimated Value: $475,000 - $552,060
3
Beds
2
Baths
1,577
Sq Ft
$334/Sq Ft
Est. Value
About This Home
This home is located at 1247 S 300 W, Payson, UT 84651 and is currently estimated at $526,765, approximately $334 per square foot. 1247 S 300 W is a home located in Utah County with nearby schools including Spring Lake Elementary, Payson High School, and Payson Junior High School.
Ownership History
Date
Name
Owned For
Owner Type
Purchase Details
Closed on
Aug 10, 2004
Sold by
Salisbury Development Lc
Bought by
Wilson Rogert R and Gayleen Wilson P
Current Estimated Value
Home Financials for this Owner
Home Financials are based on the most recent Mortgage that was taken out on this home.
Original Mortgage
$121,200
Outstanding Balance
$60,779
Interest Rate
6.17%
Mortgage Type
Purchase Money Mortgage
Estimated Equity
$465,986
Purchase Details
Closed on
Jan 15, 2004
Sold by
Bws Payson Properties Llc
Bought by
Salisbury Development L C
Create a Home Valuation Report for This Property
The Home Valuation Report is an in-depth analysis detailing your home's value as well as a comparison with similar homes in the area
Home Values in the Area
Average Home Value in this Area
Purchase History
| Date | Buyer | Sale Price | Title Company |
|---|---|---|---|
| Wilson Rogert R | -- | Provo Land Title Co | |
| Salisbury Development L C | -- | Affiliated First Title Comp |
Source: Public Records
Mortgage History
| Date | Status | Borrower | Loan Amount |
|---|---|---|---|
| Open | Wilson Rogert R | $121,200 |
Source: Public Records
Tax History Compared to Growth
Tax History
| Year | Tax Paid | Tax Assessment Tax Assessment Total Assessment is a certain percentage of the fair market value that is determined by local assessors to be the total taxable value of land and additions on the property. | Land | Improvement |
|---|---|---|---|---|
| 2025 | $2,645 | $285,945 | $178,600 | $341,300 |
| 2024 | $2,645 | $269,170 | $0 | $0 |
| 2023 | $2,688 | $274,285 | $0 | $0 |
| 2022 | $2,634 | $264,330 | $0 | $0 |
| 2021 | $2,229 | $358,800 | $117,300 | $241,500 |
| 2020 | $2,112 | $332,700 | $106,600 | $226,100 |
| 2019 | $1,946 | $314,300 | $88,200 | $226,100 |
| 2018 | $1,759 | $273,800 | $77,200 | $196,600 |
| 2017 | $1,634 | $136,785 | $0 | $0 |
| 2016 | $1,570 | $130,515 | $0 | $0 |
| 2015 | $1,467 | $121,110 | $0 | $0 |
| 2014 | $1,311 | $109,065 | $0 | $0 |
Source: Public Records
Map
Nearby Homes
- 1408 S 30 E
- 1161 Utah 198
- 1872 100 E Unit 6
- 588 W 1450 S
- 1087 S 680 W
- 1163 S 730 W
- 288 E 950 S
- 336 E 1330 S
- 598 W Saddlebrook Dr
- 1331 500 E Unit 120
- 32 E 1690 S
- 32 E 1690 S Unit 113
- 44 W 1690 S Unit 109
- The Tracie Plan at Payson View Estates - Payson View
- The Madison Plan at Payson View Estates - Payson View
- The Avery Plan at Payson View Estates - Payson View
- The Roosevelt Plan at Payson View Estates - Payson View
- The Brooke Plan at Payson View Estates - Payson View
- The Michelle Plan at Payson View Estates - Payson View
- The Elizabeth Plan at Payson View Estates - Payson View