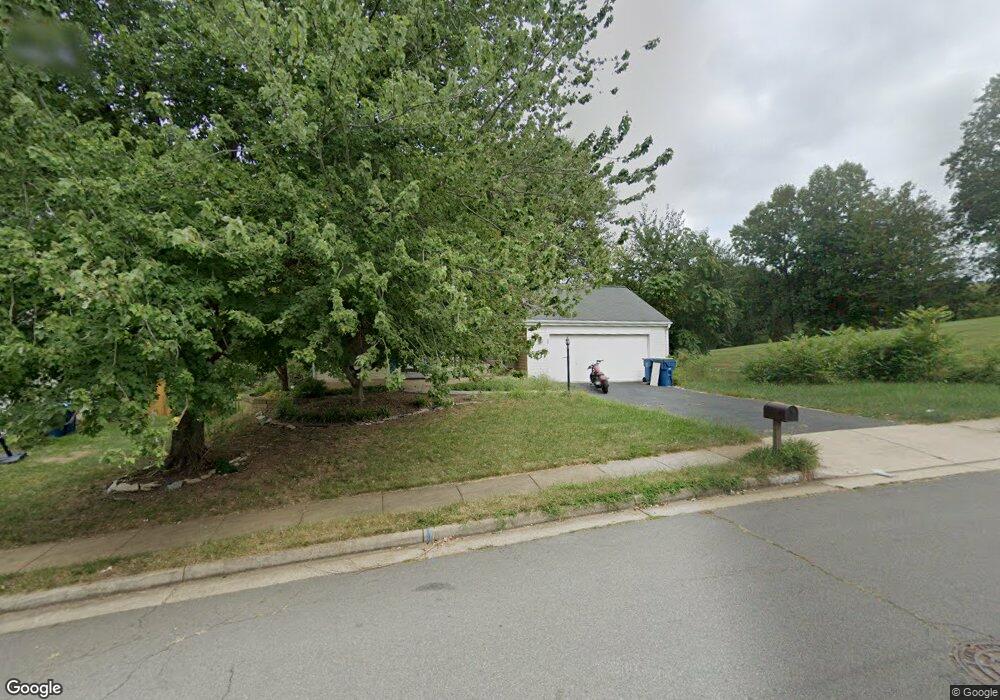
12478 Wendell Holmes Rd Herndon, VA 20171
Oak Hill NeighborhoodEstimated Value: $754,000 - $813,000
3
Beds
3
Baths
1,552
Sq Ft
$509/Sq Ft
Est. Value
About This Home
This home is located at 12478 Wendell Holmes Rd, Herndon, VA 20171 and is currently estimated at $790,128, approximately $509 per square foot. 12478 Wendell Holmes Rd is a home located in Fairfax County with nearby schools including Fox Mill Elementary School, Rachel Carson Middle School, and South Lakes High School.
Ownership History
Date
Name
Owned For
Owner Type
Purchase Details
Closed on
Aug 17, 2006
Sold by
Hall Sterlin D
Bought by
Bassam Ahdieh and Samian-Kalantari,Saied
Current Estimated Value
Home Financials for this Owner
Home Financials are based on the most recent Mortgage that was taken out on this home.
Original Mortgage
$452,000
Outstanding Balance
$273,139
Interest Rate
6.88%
Mortgage Type
New Conventional
Estimated Equity
$516,989
Purchase Details
Closed on
Aug 31, 1998
Sold by
Walker Lucile E
Bought by
Hall Sterlin D
Home Financials for this Owner
Home Financials are based on the most recent Mortgage that was taken out on this home.
Original Mortgage
$194,000
Interest Rate
6.9%
Purchase Details
Closed on
Jun 22, 1994
Sold by
Darsch Joan M
Bought by
Walker Lucile E
Home Financials for this Owner
Home Financials are based on the most recent Mortgage that was taken out on this home.
Original Mortgage
$150,000
Interest Rate
8.74%
Create a Home Valuation Report for This Property
The Home Valuation Report is an in-depth analysis detailing your home's value as well as a comparison with similar homes in the area
Home Values in the Area
Average Home Value in this Area
Purchase History
| Date | Buyer | Sale Price | Title Company |
|---|---|---|---|
| Bassam Ahdieh | $565,000 | -- | |
| Hall Sterlin D | $190,000 | -- | |
| Walker Lucile E | $187,500 | -- |
Source: Public Records
Mortgage History
| Date | Status | Borrower | Loan Amount |
|---|---|---|---|
| Open | Bassam Ahdieh | $452,000 | |
| Previous Owner | Walker Lucile E | $194,000 | |
| Previous Owner | Walker Lucile E | $150,000 |
Source: Public Records
Tax History Compared to Growth
Tax History
| Year | Tax Paid | Tax Assessment Tax Assessment Total Assessment is a certain percentage of the fair market value that is determined by local assessors to be the total taxable value of land and additions on the property. | Land | Improvement |
|---|---|---|---|---|
| 2025 | $7,885 | $716,190 | $284,000 | $432,190 |
| 2024 | $7,885 | $680,610 | $269,000 | $411,610 |
| 2023 | $7,545 | $668,610 | $269,000 | $399,610 |
| 2022 | $7,355 | $643,240 | $259,000 | $384,240 |
| 2021 | $6,962 | $593,310 | $244,000 | $349,310 |
| 2020 | $6,633 | $560,460 | $234,000 | $326,460 |
| 2019 | $6,212 | $524,910 | $214,000 | $310,910 |
| 2018 | $5,864 | $509,910 | $199,000 | $310,910 |
| 2017 | $5,920 | $509,910 | $199,000 | $310,910 |
| 2016 | $5,907 | $509,910 | $199,000 | $310,910 |
| 2015 | $5,691 | $509,910 | $199,000 | $310,910 |
| 2014 | $5,284 | $474,570 | $184,000 | $290,570 |
Source: Public Records
Map
Nearby Homes
- 12574 Quincy Adams Ct
- 2725 Robaleed Way
- 2704 Viking Dr
- 2700 Reign St
- 12402 Brown Fox Way
- 2420 Freetown Dr
- 2629 New Banner Ln
- 12205 Thoroughbred Rd
- 2418 Ridgehampton Ct
- 12816 Cross Creek Ln
- 13019 Bankfoot Ct
- 13032 Monterey Estates Dr
- 11841 Shire Ct Unit 31D
- 2904 Blue Robin Ct
- 11824 Breton Ct Unit 24A
- 2273 Hunters Run Dr
- 11837 Shire Ct Unit 22C
- 11813 Triple Crown Rd
- 11813 Breton Ct Unit 1A
- 3140 Searsmont Place
- 12480 Wendell Holmes Rd
- 12482 Wendell Holmes Rd
- 12481 Wendell Holmes Rd
- 12484 Wendell Holmes Rd
- 2641 Quincy Adams Dr
- 2647 Quincy Adams Dr
- 12474 Wendell Holmes Rd
- 12475 Wendell Holmes Rd
- 2702 Robaleed Way Unit 115-345
- 2629 Quincy Adams Dr
- 2649 Quincy Adams Dr
- 2636 Quincy Adams Dr
- 2638 Quincy Adams Dr
- 12470 Wendell Holmes Rd
- 12473 Wendell Holmes Rd
- 2634 Quincy Adams Dr
- 2627 Quincy Adams Dr
- 2704 Robaleed Way
- 2650 Quincy Adams Dr
- 2701 Robaleed Way