Estimated Value: $696,557 - $770,000
3
Beds
3
Baths
2,043
Sq Ft
$360/Sq Ft
Est. Value
About This Home
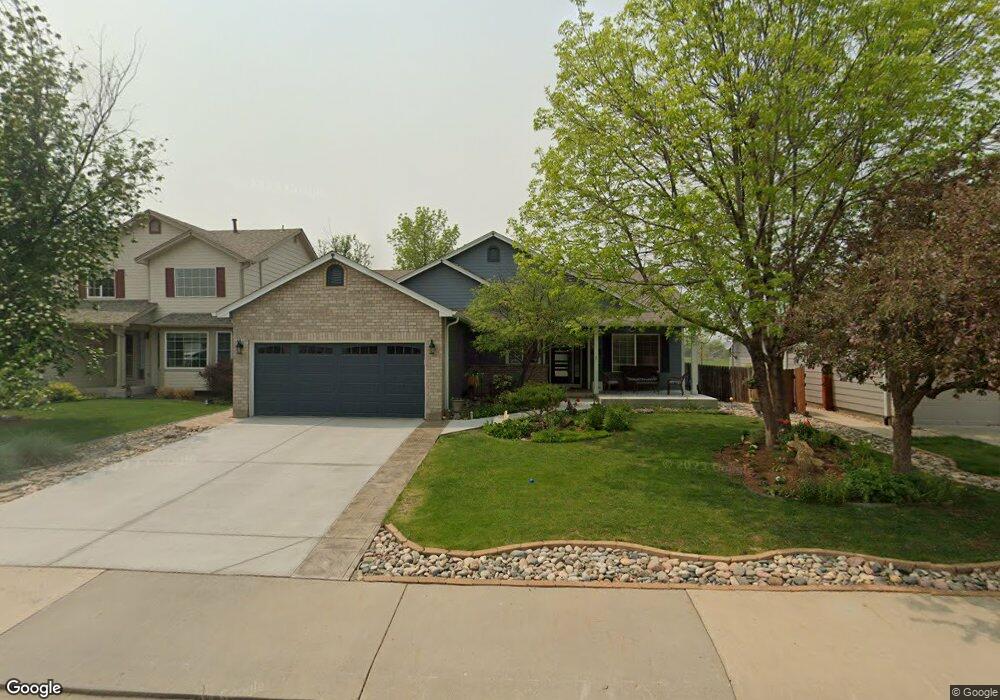
This home is located at 1248 Banner Cir, Erie, CO 80516 and is currently estimated at $735,389, approximately $359 per square foot. 1248 Banner Cir is a home located in Boulder County with nearby schools including Erie Elementary School, Erie Middle School, and Erie High School.
Ownership History
Date
Name
Owned For
Owner Type
Purchase Details
Closed on
Dec 17, 2004
Sold by
Curtis Gary L and Curtis Jean M
Bought by
Jordan William C and Jordan Nannette J
Current Estimated Value
Home Financials for this Owner
Home Financials are based on the most recent Mortgage that was taken out on this home.
Original Mortgage
$244,000
Outstanding Balance
$121,300
Interest Rate
5.62%
Mortgage Type
Purchase Money Mortgage
Estimated Equity
$614,089
Purchase Details
Closed on
May 1, 2001
Sold by
Harrington Joyce A and Harrington Kevin B
Bought by
Curtis Gary L and Curtis Jean M
Home Financials for this Owner
Home Financials are based on the most recent Mortgage that was taken out on this home.
Original Mortgage
$185,995
Interest Rate
6.81%
Purchase Details
Closed on
May 19, 2000
Sold by
Melody Homes Inc
Bought by
Harrington Kevin B
Home Financials for this Owner
Home Financials are based on the most recent Mortgage that was taken out on this home.
Original Mortgage
$188,750
Interest Rate
8.19%
Create a Home Valuation Report for This Property
The Home Valuation Report is an in-depth analysis detailing your home's value as well as a comparison with similar homes in the area
Home Values in the Area
Average Home Value in this Area
Purchase History
| Date | Buyer | Sale Price | Title Company |
|---|---|---|---|
| Jordan William C | $305,000 | -- | |
| Curtis Gary L | $295,995 | Land Title | |
| Harrington Kevin B | $235,971 | Land Title |
Source: Public Records
Mortgage History
| Date | Status | Borrower | Loan Amount |
|---|---|---|---|
| Open | Jordan William C | $244,000 | |
| Previous Owner | Curtis Gary L | $185,995 | |
| Previous Owner | Harrington Kevin B | $188,750 | |
| Closed | Jordan William C | $61,000 |
Source: Public Records
Tax History Compared to Growth
Tax History
| Year | Tax Paid | Tax Assessment Tax Assessment Total Assessment is a certain percentage of the fair market value that is determined by local assessors to be the total taxable value of land and additions on the property. | Land | Improvement |
|---|---|---|---|---|
| 2025 | $4,950 | $46,056 | $11,100 | $34,956 |
| 2024 | $4,950 | $46,056 | $11,100 | $34,956 |
| 2023 | $4,894 | $43,215 | $14,747 | $32,153 |
| 2022 | $4,311 | $36,418 | $9,292 | $27,126 |
| 2021 | $4,387 | $37,466 | $9,560 | $27,906 |
| 2020 | $4,033 | $34,521 | $5,935 | $28,586 |
| 2019 | $4,022 | $34,521 | $5,935 | $28,586 |
| 2018 | $3,855 | $33,026 | $8,352 | $24,674 |
| 2017 | $3,275 | $32,493 | $9,234 | $23,259 |
| 2016 | $3,185 | $27,907 | $8,676 | $19,231 |
| 2015 | $3,057 | $22,105 | $9,950 | $12,155 |
| 2014 | $2,475 | $22,105 | $9,950 | $12,155 |
Source: Public Records
Map
Nearby Homes
- 1309 Banner Cir
- 1376 Banner Cir
- 1475 Davis Ct
- 1166 St John St
- 1020 Village Cir Unit 1014
- 1366 Padfield Place
- 881 Meadowlark Dr
- 1183 Richards Ct
- 890 Meadowlark Dr
- 11724 Kenosha Rd
- 800 Meadowlark Dr
- 11880 Juniper St
- 885 Delechant Dr
- 4292 N 119th St
- 740 Meadowlark Dr
- 785 Delechant Dr
- 12640 Jay Rd
- Plan 2651 Modeled at Canyon Creek - The Nest Reserve
- Plan 2390 at Canyon Creek - The Nest Reserve
- Plan 2193 at Canyon Creek - The Nest Reserve
- 1244 Banner Cir
- 1254 Banner Cir
- 1240 Banner Cir
- 1258 Banner Cir
- 1249 Banner Cir
- 1245 Banner Cir
- 1255 Banner Cir
- 1241 Banner Cir
- 1259 Banner Cir
- 1235 Banner Cir
- 1230 Banner Cir
- 1278 N Davenport Ct
- 1266 N Davenport Ct
- 1231 Banner Cir
- 1252 N Davenport Ct
- 1263 Banner Cir
- 1226 Banner Cir
- 1240 N Davenport Ct
- 1268 Banner Cir
- 1228 N Davenport Ct