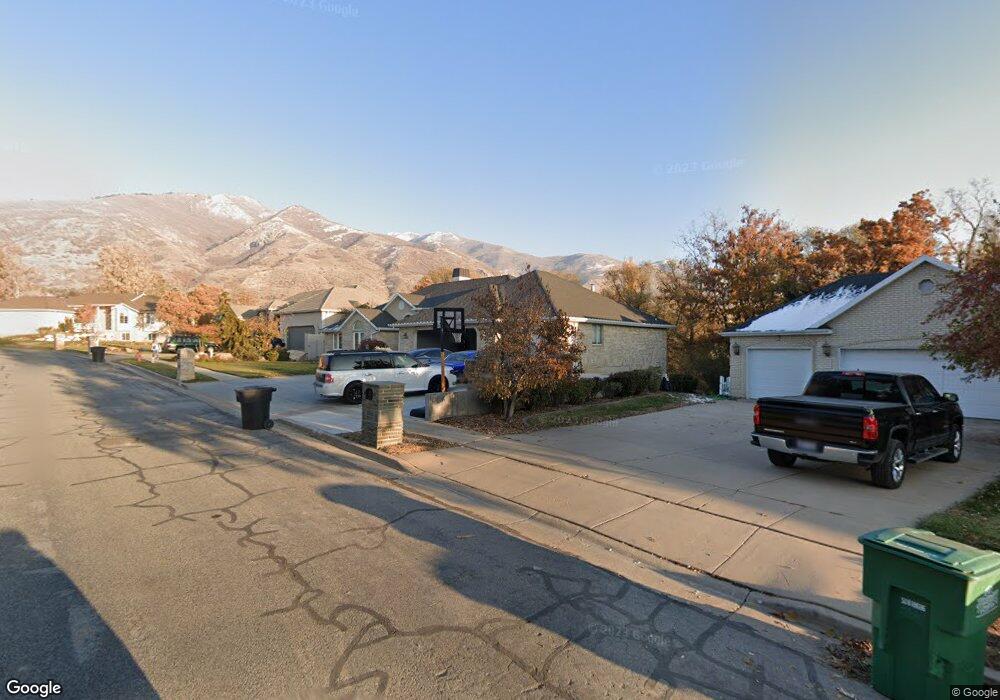
1248 Birdie Ln Kaysville, UT 84037
Estimated Value: $894,000 - $1,059,000
5
Beds
4
Baths
2,364
Sq Ft
$398/Sq Ft
Est. Value
About This Home
This home is located at 1248 Birdie Ln, Kaysville, UT 84037 and is currently estimated at $940,150, approximately $397 per square foot. 1248 Birdie Ln is a home located in Davis County with nearby schools including H.C. Burton Elementary School, Kaysville Junior High School, and Davis High School.
Ownership History
Date
Name
Owned For
Owner Type
Purchase Details
Closed on
Aug 6, 2019
Sold by
Johansen Amy
Bought by
Johansen Amy J and The Amy Johansen Revocable Tru
Current Estimated Value
Purchase Details
Closed on
Sep 25, 2017
Sold by
Johansen Jeffery W and Johansen Amy J
Bought by
Johansen Amy
Purchase Details
Closed on
Sep 17, 2002
Sold by
Johansen Jeffrey W and Johansen Amy
Bought by
Johansen Jeffery W and Johansen Amy J
Home Financials for this Owner
Home Financials are based on the most recent Mortgage that was taken out on this home.
Original Mortgage
$150,000
Interest Rate
6.16%
Purchase Details
Closed on
Mar 5, 2001
Sold by
Johansen Jeffrey
Bought by
Johansen Jeffery W and Johansen Amy
Home Financials for this Owner
Home Financials are based on the most recent Mortgage that was taken out on this home.
Original Mortgage
$60,001
Interest Rate
7.12%
Create a Home Valuation Report for This Property
The Home Valuation Report is an in-depth analysis detailing your home's value as well as a comparison with similar homes in the area
Home Values in the Area
Average Home Value in this Area
Purchase History
| Date | Buyer | Sale Price | Title Company |
|---|---|---|---|
| Johansen Amy J | -- | None Available | |
| Johansen Amy | -- | -- | |
| Johansen Jeffery W | -- | American Preferred Title Llc | |
| Johansen Jeffery W | -- | Associated Title Company | |
| Johansen Jeffrey | -- | Associated Title Company |
Source: Public Records
Mortgage History
| Date | Status | Borrower | Loan Amount |
|---|---|---|---|
| Closed | Johansen Jeffery W | $150,000 | |
| Closed | Johansen Jeffrey | $60,001 |
Source: Public Records
Tax History Compared to Growth
Tax History
| Year | Tax Paid | Tax Assessment Tax Assessment Total Assessment is a certain percentage of the fair market value that is determined by local assessors to be the total taxable value of land and additions on the property. | Land | Improvement |
|---|---|---|---|---|
| 2024 | $622 | $448,250 | $266,769 | $181,481 |
| 2023 | $289 | $774,000 | $414,326 | $359,674 |
| 2022 | $4,313 | $437,250 | $214,135 | $223,115 |
| 2021 | $781 | $634,000 | $330,116 | $303,884 |
| 2020 | $3,726 | $553,000 | $282,222 | $270,778 |
| 2019 | $3,726 | $546,000 | $295,814 | $250,186 |
| 2018 | $3,419 | $494,000 | $244,284 | $249,716 |
| 2016 | $302 | $253,715 | $129,016 | $124,699 |
| 2015 | $3,414 | $244,365 | $129,016 | $115,349 |
| 2014 | $473 | $227,721 | $129,016 | $98,705 |
| 2013 | -- | $200,527 | $63,322 | $137,205 |
Source: Public Records
Map
Nearby Homes
- 1419 E Heights Way Unit 15
- 1053 Sage Ln
- 1043 S Oxford Cir
- 1543 Mirabella Way Unit 21
- 1644 E Old Lake Ln
- 399 Stirling Dr E
- 1351 E 400 S
- 947 S Honeysuckle Way
- 960 E Par Three Cir
- 2076 Summerwood Dr
- 362 Glen Cir
- 570 S 1800 E
- 358 S Eastoaks Dr
- 830 E 1250 S
- 617 E Whisper Creek Dr
- 947 E Green Rd
- 1175 W 1875 N
- 557 E Warm Springs Dr
- 673 S Main St
- 1372 Sweetwater Ln