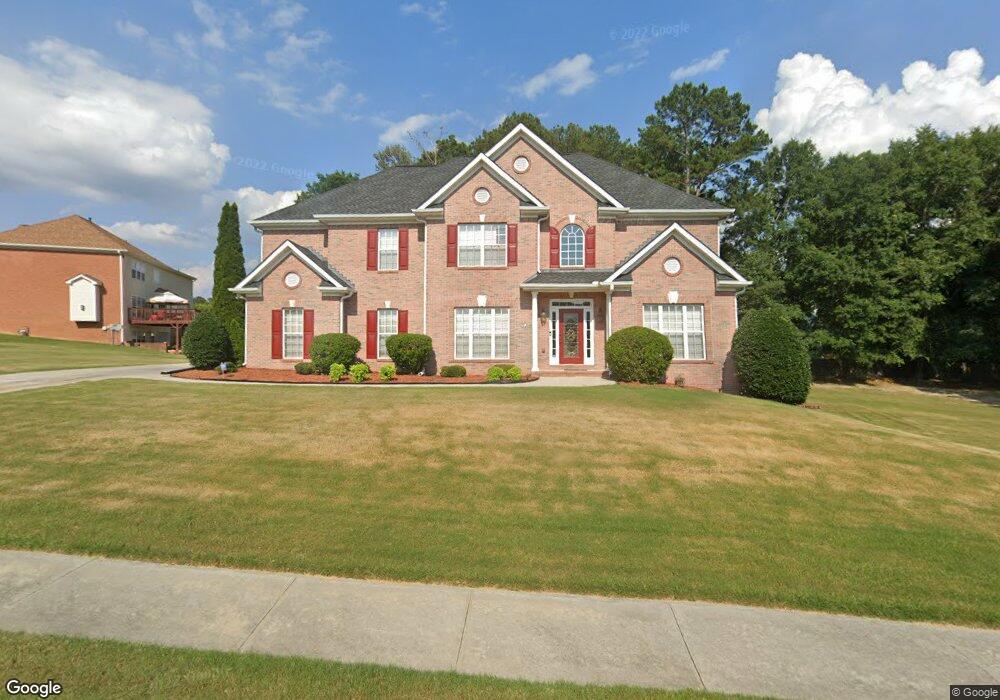
1248 Rhodes Walk Conyers, GA 30094
Estimated Value: $426,084 - $671,000
5
Beds
4
Baths
3,268
Sq Ft
$160/Sq Ft
Est. Value
About This Home
This home is located at 1248 Rhodes Walk, Conyers, GA 30094 and is currently estimated at $524,271, approximately $160 per square foot. 1248 Rhodes Walk is a home located in Rockdale County with nearby schools including Shoal Creek Elementary School, Gen. Ray Davis Middle School, and Rockdale County High School.
Ownership History
Date
Name
Owned For
Owner Type
Purchase Details
Closed on
Dec 30, 2015
Sold by
Franks Carolyn
Bought by
Franks Harold Bernard
Current Estimated Value
Purchase Details
Closed on
Sep 11, 2008
Sold by
Option One Trust 2003-6
Bought by
Franks Harold B and Franks Harold
Home Financials for this Owner
Home Financials are based on the most recent Mortgage that was taken out on this home.
Original Mortgage
$237,810
Interest Rate
6.48%
Mortgage Type
FHA
Purchase Details
Closed on
Jul 3, 2007
Sold by
Hazley Jane
Bought by
Option One Mtg Loan 2003-6
Purchase Details
Closed on
Sep 24, 2003
Sold by
Classic Smith Hms Inc
Bought by
Hazley Jane
Home Financials for this Owner
Home Financials are based on the most recent Mortgage that was taken out on this home.
Original Mortgage
$56,263
Interest Rate
6.32%
Mortgage Type
New Conventional
Create a Home Valuation Report for This Property
The Home Valuation Report is an in-depth analysis detailing your home's value as well as a comparison with similar homes in the area
Home Values in the Area
Average Home Value in this Area
Purchase History
| Date | Buyer | Sale Price | Title Company |
|---|---|---|---|
| Franks Harold Bernard | -- | -- | |
| Franks Carolyn | -- | -- | |
| Franks Harold B | $239,690 | -- | |
| Option One Mtg Loan 2003-6 | $244,000 | -- | |
| Hazley Jane | $281,400 | -- |
Source: Public Records
Mortgage History
| Date | Status | Borrower | Loan Amount |
|---|---|---|---|
| Previous Owner | Franks Harold B | $237,810 | |
| Previous Owner | Hazley Jane | $56,263 |
Source: Public Records
Tax History Compared to Growth
Tax History
| Year | Tax Paid | Tax Assessment Tax Assessment Total Assessment is a certain percentage of the fair market value that is determined by local assessors to be the total taxable value of land and additions on the property. | Land | Improvement |
|---|---|---|---|---|
| 2024 | $4,664 | $184,880 | $28,200 | $156,680 |
| 2023 | $3,671 | $152,200 | $28,200 | $124,000 |
| 2022 | $3,490 | $145,120 | $28,200 | $116,920 |
| 2021 | $2,863 | $113,320 | $22,800 | $90,520 |
| 2020 | $2,936 | $111,680 | $17,400 | $94,280 |
| 2019 | $3,009 | $111,680 | $17,400 | $94,280 |
| 2018 | $1,911 | $75,600 | $9,600 | $66,000 |
| 2017 | $1,721 | $68,720 | $9,600 | $59,120 |
| 2016 | $3,162 | $68,720 | $9,600 | $59,120 |
| 2015 | $1,594 | $68,720 | $9,600 | $59,120 |
| 2014 | $1,427 | $68,720 | $9,600 | $59,120 |
| 2013 | -- | $97,080 | $16,000 | $81,080 |
Source: Public Records
Map
Nearby Homes
- 1221 Rhodes Walk SW
- 2881 Bridle Creek Dr SW Unit 1
- 3011 Flat Shoals Rd SW
- 2887 Bridle Creek Dr SW
- 2856 Flat Shoals Rd SW
- 2917 Bridle Creek Dr SW Unit 2
- 2900 Waterford Dr SW
- 2989 Waterford Dr SW
- 3208 Highpoint Way SW
- 3055 SW Reserve Ct
- 3059 SW Reserve Ct
- 1401 Stone Bridge Ln SW
- 2505 Laurel Ridge Place SW
- 2477 Laurel Ridge Place SW
- 3016 Heights Ave SW
- 1103 W Adrian Cir SW
- 1107 W Adrian Cir SW
- 2923 Hurst Rd SW
- 1509 Shoal Creek Dr SW
- 1240 Rhodes Walk
- 1300 Gilford Place Unit 2
- 1025 Alexandria Ln
- 1245 Rhodes Walk Unit 2
- 1236 Rhodes Walk
- 0 Rhodes Walk Unit 9055171
- 1401 Hadlow Ct SE
- 1401 Hadlow Ct SE Unit 39
- 1401 Hadlow Ct
- 1401 Hadlow Ct Unit 39
- 1024 Alexandria Ln
- 1255 Rhodes Walk
- 0 Gilford Place SW Unit 8296628
- 0 Gilford Place SW Unit 8001208
- 1232 Rhodes Walk Unit 1
- 1241 Rhodes Walk Unit 2
- 1306 Gilford Place Unit 2
- 1405 Hadlow Ct
- 1237 Rhodes Walk Unit 2
- 1405 Hadlow Ct SE Unit Two