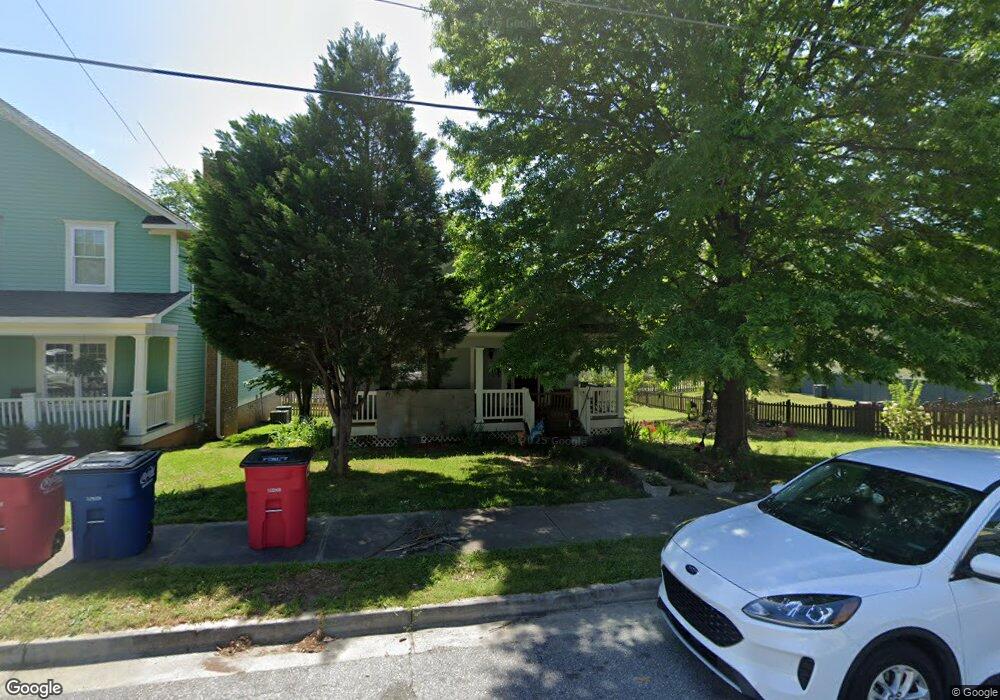
1248 Ross St Macon, GA 31201
Bealls Hill Historic District NeighborhoodEstimated Value: $147,457 - $226,000
3
Beds
2
Baths
1,092
Sq Ft
$170/Sq Ft
Est. Value
About This Home
This home is located at 1248 Ross St, Macon, GA 31201 and is currently estimated at $185,864, approximately $170 per square foot. 1248 Ross St is a home located in Bibb County with nearby schools including Ingram-Pye Elementary School, Southwest High School, and St. Joseph's Catholic School.
Ownership History
Date
Name
Owned For
Owner Type
Purchase Details
Closed on
Nov 15, 2013
Sold by
The Macon Bibb County Land Bank Authorit
Bought by
England Connie
Current Estimated Value
Purchase Details
Closed on
Jun 27, 2007
Sold by
Housing Authority City Macon Georgia
Bought by
England Connie
Home Financials for this Owner
Home Financials are based on the most recent Mortgage that was taken out on this home.
Original Mortgage
$68,200
Interest Rate
6.16%
Mortgage Type
Unknown
Purchase Details
Closed on
Apr 20, 2005
Purchase Details
Closed on
Dec 15, 2003
Create a Home Valuation Report for This Property
The Home Valuation Report is an in-depth analysis detailing your home's value as well as a comparison with similar homes in the area
Home Values in the Area
Average Home Value in this Area
Purchase History
| Date | Buyer | Sale Price | Title Company |
|---|---|---|---|
| England Connie | -- | None Available | |
| England Connie | -- | None Available | |
| -- | -- | -- | |
| -- | $35,000 | -- |
Source: Public Records
Mortgage History
| Date | Status | Borrower | Loan Amount |
|---|---|---|---|
| Previous Owner | England Connie | $68,200 |
Source: Public Records
Tax History
| Year | Tax Paid | Tax Assessment Tax Assessment Total Assessment is a certain percentage of the fair market value that is determined by local assessors to be the total taxable value of land and additions on the property. | Land | Improvement |
|---|---|---|---|---|
| 2025 | $1,163 | $54,314 | $6,600 | $47,714 |
| 2024 | $1,202 | $54,314 | $6,600 | $47,714 |
| 2023 | $1,148 | $45,762 | $6,000 | $39,762 |
| 2022 | $1,793 | $58,775 | $12,071 | $46,704 |
| 2021 | $1,437 | $44,822 | $9,286 | $35,536 |
| 2020 | $1,468 | $44,822 | $9,286 | $35,536 |
| 2019 | $1,481 | $44,822 | $9,286 | $35,536 |
| 2018 | $2,627 | $44,822 | $9,286 | $35,536 |
| 2017 | $1,354 | $43,129 | $9,286 | $33,843 |
| 2016 | $1,250 | $43,129 | $9,286 | $33,843 |
| 2015 | $1,770 | $43,129 | $9,286 | $33,843 |
| 2014 | $2,086 | $43,129 | $9,286 | $33,843 |
Source: Public Records
Map
Nearby Homes
Your Personal Tour Guide
Ask me questions while you tour the home.