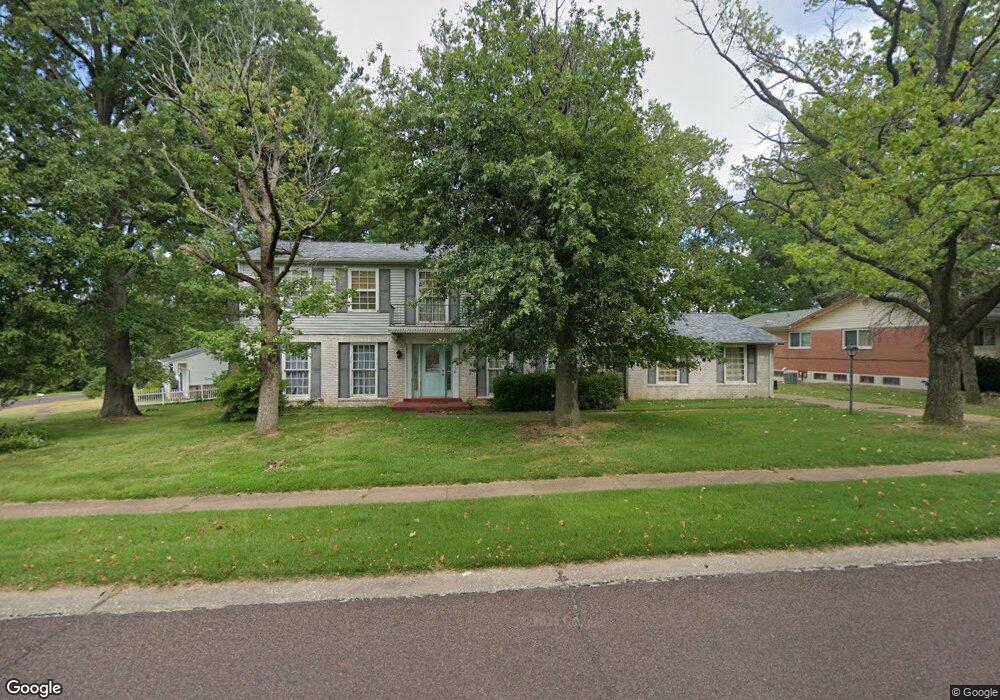
12484 Partridge Run Dr Florissant, MO 63033
Estimated Value: $193,000 - $294,000
4
Beds
3
Baths
2,632
Sq Ft
$99/Sq Ft
Est. Value
About This Home
This home is located at 12484 Partridge Run Dr, Florissant, MO 63033 and is currently estimated at $260,465, approximately $98 per square foot. 12484 Partridge Run Dr is a home located in St. Louis County with nearby schools including Townsend Elementary School, Central Middle School, and Hazelwood Central High School.
Ownership History
Date
Name
Owned For
Owner Type
Purchase Details
Closed on
Apr 22, 2010
Sold by
Secretary Of Housing & Urban Development
Bought by
Quinn Patrick P
Current Estimated Value
Home Financials for this Owner
Home Financials are based on the most recent Mortgage that was taken out on this home.
Original Mortgage
$138,380
Outstanding Balance
$93,300
Interest Rate
5.25%
Mortgage Type
FHA
Estimated Equity
$167,165
Purchase Details
Closed on
Nov 25, 2009
Sold by
Spencer Randolph
Bought by
Chase Home Finance Llc
Purchase Details
Closed on
Nov 24, 2009
Sold by
Chase Home Finance Llc
Bought by
Secretary Of Housing & Urban Development
Purchase Details
Closed on
Dec 8, 2006
Sold by
Tiernan Eugene J and Tiernan Estella M
Bought by
Spencer Randolph
Home Financials for this Owner
Home Financials are based on the most recent Mortgage that was taken out on this home.
Original Mortgage
$187,064
Interest Rate
6.31%
Mortgage Type
FHA
Create a Home Valuation Report for This Property
The Home Valuation Report is an in-depth analysis detailing your home's value as well as a comparison with similar homes in the area
Home Values in the Area
Average Home Value in this Area
Purchase History
| Date | Buyer | Sale Price | Title Company |
|---|---|---|---|
| Quinn Patrick P | $141,650 | Fatco | |
| Chase Home Finance Llc | $207,687 | None Available | |
| Secretary Of Housing & Urban Development | -- | None Available | |
| Spencer Randolph | $190,000 | None Available |
Source: Public Records
Mortgage History
| Date | Status | Borrower | Loan Amount |
|---|---|---|---|
| Open | Quinn Patrick P | $138,380 | |
| Previous Owner | Spencer Randolph | $187,064 |
Source: Public Records
Tax History Compared to Growth
Tax History
| Year | Tax Paid | Tax Assessment Tax Assessment Total Assessment is a certain percentage of the fair market value that is determined by local assessors to be the total taxable value of land and additions on the property. | Land | Improvement |
|---|---|---|---|---|
| 2025 | $4,196 | $47,880 | $3,480 | $44,400 |
| 2024 | $4,196 | $46,210 | $3,480 | $42,730 |
| 2023 | $4,181 | $46,210 | $3,480 | $42,730 |
| 2022 | $3,649 | $35,850 | $7,710 | $28,140 |
| 2021 | $3,453 | $35,850 | $7,710 | $28,140 |
| 2020 | $3,162 | $30,560 | $5,800 | $24,760 |
| 2019 | $3,112 | $30,560 | $5,800 | $24,760 |
| 2018 | $2,750 | $24,950 | $3,900 | $21,050 |
| 2017 | $2,747 | $24,950 | $3,900 | $21,050 |
| 2016 | $3,218 | $28,790 | $3,120 | $25,670 |
| 2015 | $3,144 | $28,790 | $3,120 | $25,670 |
| 2014 | $2,773 | $25,250 | $4,940 | $20,310 |
Source: Public Records
Map
Nearby Homes
- 6660 Lakeside Hills Dr
- 6665 Lakeside Hills Dr
- 12432 Quatre Dr
- 12670 Verwood Dr
- 12713 Partridge Run Dr
- 6587 Dolphin Cir E Unit 110B
- 12225 Tarpon Dr
- 6595 Dolphin Cir E Unit 131A
- 6691 Parker Rd Unit C
- 6250 Pennyrich Ct
- 12136 La Padera Ln
- 6646 Foothills Ct
- 12435 Sea Lane Dr Unit 5
- 12750 Needle Point Ct
- 12456 Sea Lane Dr Unit A
- 6363 Coventry Dr
- 12095 El Camara Dr
- 17 Nob Hill Dr
- 11760 Sheffield Dr
- 6803 Foxbend Ct
- 12464 Partridge Run Dr
- 6710 Lakeside Hills Dr
- 12453 Quatre Dr
- 6680 Lakeside Hills Dr
- 12454 Partridge Run Dr
- 6571 Sagamore Hills Ct
- 6720 Lakeside Hills Dr
- 6685 Lakeside Hills Dr
- 6703 Landau Dr
- 12443 Quatre Dr
- 6670 Lakeside Hills Dr
- 12444 Partridge Run Dr
- 6675 Lakeside Hills Dr
- 6561 Sagamore Hills Ct
- 6730 Lakeside Hills Dr
- 6561 Sagamore Hill Ct
- 12433 Quatre Dr
- 12534 Partridge Run Dr
- 6713 Landau Dr
- 6572 Sagamore Hills Ct