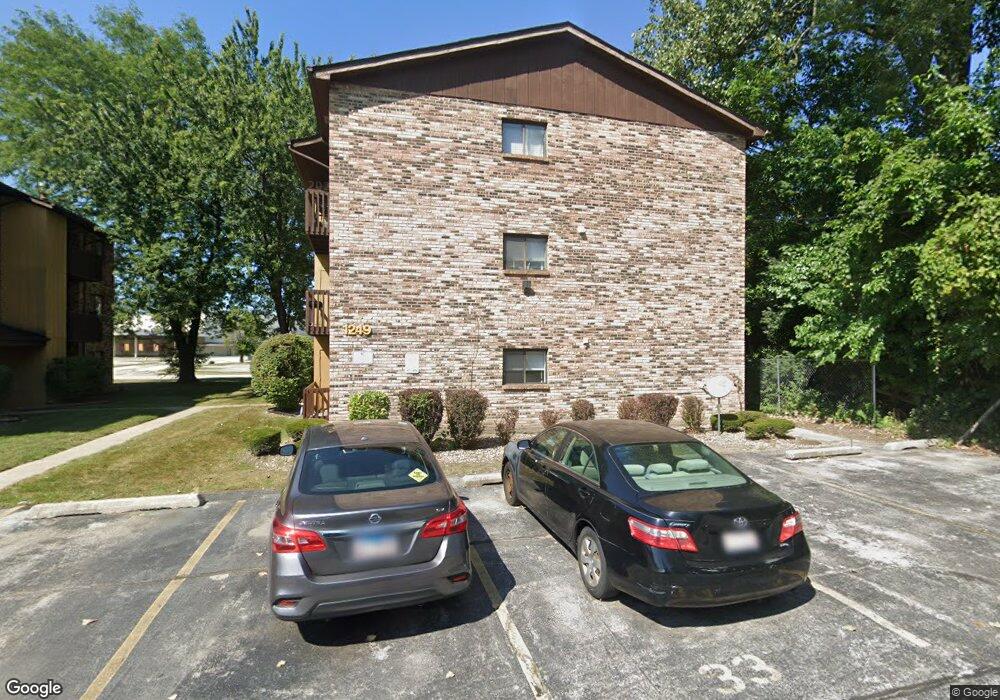
1249 Cunningham Dr Unit 6W1 Calumet City, IL 60409
Estimated Value: $61,000 - $102,118
2
Beds
1
Bath
950
Sq Ft
$80/Sq Ft
Est. Value
About This Home
This home is located at 1249 Cunningham Dr Unit 6W1, Calumet City, IL 60409 and is currently estimated at $75,706, approximately $79 per square foot. 1249 Cunningham Dr Unit 6W1 is a home located in Cook County with nearby schools including Hoover Elementary School, Schrum Memorial Middle School, and Thornton Fractional North High School.
Ownership History
Date
Name
Owned For
Owner Type
Purchase Details
Closed on
Mar 7, 2023
Sold by
Vrmtg Asset Trust
Bought by
Rose William Louis
Current Estimated Value
Purchase Details
Closed on
Oct 26, 2022
Sold by
Judicial Sales Corporation
Bought by
Vrmtg Asset Trust and Us Bank Trust
Purchase Details
Closed on
Feb 26, 2007
Sold by
Abrams Jacqueline
Bought by
Stevens Lawrence
Home Financials for this Owner
Home Financials are based on the most recent Mortgage that was taken out on this home.
Original Mortgage
$74,500
Interest Rate
6.28%
Mortgage Type
Unknown
Purchase Details
Closed on
Oct 31, 1995
Sold by
Hylton Veronica
Bought by
Abrams Jacqueline
Home Financials for this Owner
Home Financials are based on the most recent Mortgage that was taken out on this home.
Original Mortgage
$46,900
Interest Rate
7.61%
Mortgage Type
FHA
Create a Home Valuation Report for This Property
The Home Valuation Report is an in-depth analysis detailing your home's value as well as a comparison with similar homes in the area
Home Values in the Area
Average Home Value in this Area
Purchase History
| Date | Buyer | Sale Price | Title Company |
|---|---|---|---|
| Rose William Louis | $43,500 | None Listed On Document | |
| Vrmtg Asset Trust | -- | None Listed On Document | |
| Stevens Lawrence | $74,500 | Fatic | |
| Abrams Jacqueline | $47,500 | -- |
Source: Public Records
Mortgage History
| Date | Status | Borrower | Loan Amount |
|---|---|---|---|
| Previous Owner | Stevens Lawrence | $74,500 | |
| Previous Owner | Abrams Jacqueline | $46,900 |
Source: Public Records
Tax History Compared to Growth
Tax History
| Year | Tax Paid | Tax Assessment Tax Assessment Total Assessment is a certain percentage of the fair market value that is determined by local assessors to be the total taxable value of land and additions on the property. | Land | Improvement |
|---|---|---|---|---|
| 2024 | $3,296 | $5,011 | $846 | $4,165 |
| 2023 | $2,568 | $5,011 | $846 | $4,165 |
| 2022 | $2,568 | $3,014 | $896 | $2,118 |
| 2021 | $2,520 | $3,012 | $895 | $2,117 |
| 2020 | $3,236 | $3,012 | $895 | $2,117 |
| 2019 | $0 | $3,231 | $796 | $2,435 |
| 2018 | $0 | $4,554 | $796 | $3,758 |
| 2017 | $3,236 | $4,554 | $796 | $3,758 |
| 2016 | $1,399 | $3,833 | $746 | $3,087 |
| 2015 | $2,545 | $3,833 | $746 | $3,087 |
| 2014 | $1,352 | $6,521 | $746 | $5,775 |
| 2013 | $2,563 | $6,969 | $746 | $6,223 |
Source: Public Records
Map
Nearby Homes
- 1259 Cunningham Dr Unit 3W
- 1259 Cunningham Dr Unit 1E
- 1249 Cunningham Dr Unit 3E
- 1253 Cunningham Dr Unit 2W
- 1322 River Dr
- 1278 Balmoral Ave
- 1290 Balmoral Ave
- 1261 Balmoral Ave
- 916 William St
- 1229 Arthur St
- 1287 Arthur St
- 836 Williams St
- 826 Williams St
- 1365 Imperial Ave
- 1367 Buffalo Ave
- 1317 Mackinaw Ave
- 1262 Greenbay Ave
- 1295 Greenbay Ave
- 1272 Burnham Ave
- 1383 Greenbay Ave
- 1249 Cunningham Dr Unit 6W3
- 1249 Cunningham Dr Unit 6E2
- 1249 Cunningham Dr Unit 6E3
- 1249 Cunningham Dr Unit 6W2
- 1249 Cunningham Dr Unit 2W
- 1249 Cunningham Dr Unit 1W
- 1249 Cunningham Dr Unit 1E
- 1255 Cunningham Dr Unit 3W2
- 1255 Cunningham Dr Unit 3E3
- 1255 Cunningham Dr Unit 3W3
- 1255 Cunningham Dr Unit 3E2
- 1255 Cunningham Dr Unit 1E
- 1255 Cunningham Dr Unit 2E
- 1255 Cunningham Dr Unit 3W
- 1255 Cunningham Dr Unit 1W
- 1253 Cunningham Dr Unit 4E1
- 1253 Cunningham Dr Unit 4E3
- 1253 Cunningham Dr Unit 4W3
- 1253 Cunningham Dr Unit 4E2
- 1253 Cunningham Dr Unit 4W1