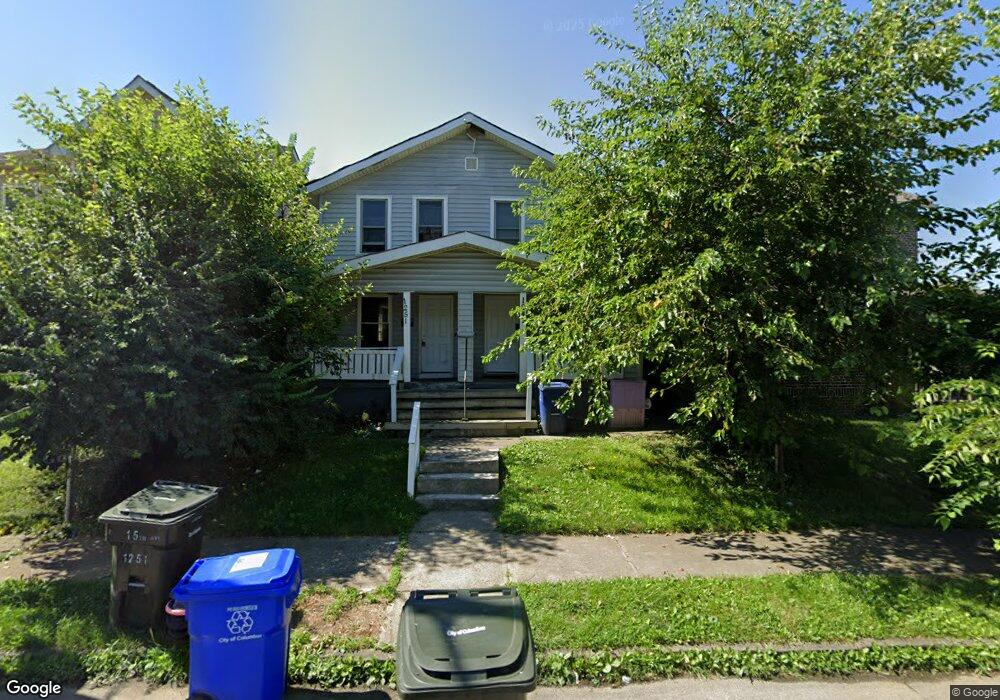
1249 E 15th Ave Unit 251 Columbus, OH 43211
South Linden NeighborhoodEstimated Value: $180,000 - $248,000
6
Beds
2
Baths
2,288
Sq Ft
$90/Sq Ft
Est. Value
About This Home
This home is located at 1249 E 15th Ave Unit 251, Columbus, OH 43211 and is currently estimated at $206,001, approximately $90 per square foot. 1249 E 15th Ave Unit 251 is a home located in Franklin County with nearby schools including Windsor Stem Acadmey, Linden-Mckinley Stem School On Arcadia, and North Columbus Preparatory Academy.
Ownership History
Date
Name
Owned For
Owner Type
Purchase Details
Closed on
Mar 1, 2022
Sold by
Blue Rose Investments I Llc
Bought by
368 Properties Llc
Current Estimated Value
Home Financials for this Owner
Home Financials are based on the most recent Mortgage that was taken out on this home.
Original Mortgage
$178,500
Interest Rate
3.55%
Mortgage Type
Construction
Purchase Details
Closed on
Feb 11, 2022
Sold by
Blue Rose Investments I Llc
Bought by
368 Properties Llc
Home Financials for this Owner
Home Financials are based on the most recent Mortgage that was taken out on this home.
Original Mortgage
$178,500
Interest Rate
3.55%
Mortgage Type
Construction
Purchase Details
Closed on
Mar 21, 2018
Sold by
Kost Richard and Kost Deborah
Bought by
Blue Rose Investments Llc
Purchase Details
Closed on
Dec 19, 1984
Bought by
Kost Richard C
Create a Home Valuation Report for This Property
The Home Valuation Report is an in-depth analysis detailing your home's value as well as a comparison with similar homes in the area
Home Values in the Area
Average Home Value in this Area
Purchase History
| Date | Buyer | Sale Price | Title Company |
|---|---|---|---|
| 368 Properties Llc | $130,000 | Pm Title | |
| 368 Properties Llc | $130,000 | Pm Title | |
| Blue Rose Investments Llc | -- | Chasr Title Box | |
| Kost Richard C | $13,000 | -- |
Source: Public Records
Mortgage History
| Date | Status | Borrower | Loan Amount |
|---|---|---|---|
| Closed | 368 Properties Llc | $178,500 | |
| Closed | 368 Properties Llc | $178,500 |
Source: Public Records
Tax History
| Year | Tax Paid | Tax Assessment Tax Assessment Total Assessment is a certain percentage of the fair market value that is determined by local assessors to be the total taxable value of land and additions on the property. | Land | Improvement |
|---|---|---|---|---|
| 2025 | $7,284 | $58,910 | $5,110 | $53,800 |
| 2024 | $7,284 | $58,910 | $5,110 | $53,800 |
| 2023 | $2,956 | $58,905 | $5,110 | $53,795 |
| 2022 | $1,681 | $21,080 | $2,140 | $18,940 |
| 2021 | $1,122 | $21,080 | $2,140 | $18,940 |
| 2020 | $1,124 | $21,080 | $2,140 | $18,940 |
| 2019 | $1,091 | $17,540 | $1,750 | $15,790 |
| 2018 | $889 | $17,540 | $1,750 | $15,790 |
| 2017 | $924 | $17,540 | $1,750 | $15,790 |
| 2016 | $757 | $11,140 | $2,280 | $8,860 |
| 2015 | $689 | $11,140 | $2,280 | $8,860 |
| 2014 | $691 | $11,140 | $2,280 | $8,860 |
| 2013 | $378 | $12,355 | $2,520 | $9,835 |
Source: Public Records
Map
Nearby Homes
- 1249-1251 E 15th Ave
- 1673 Cleveland Ave
- 1121 Windsor Ave
- 0 Windsor Ave
- 1111 Windsor Ave
- 1315 E 18th Ave
- 1109 Windsor Ave Unit 1103
- 1129 E 17th Ave
- 1027 E 14th Ave
- 1201 E 20th Ave
- 957 E 12th Ave
- 1538-1542 Accommodation Ave
- 1705 Lexington Ave
- 1386 E 22nd Ave
- 957 E 17th Ave
- 915 E 13th Ave
- 1136 E 21st Ave
- 1218 E 22nd Ave
- 1045-1051 E 20th Ave
- 1638 Joyce Ave
- 1251 E 15th Ave
- 1255 E 15th Ave
- 1245 E 15th Ave
- 1259 E 15th Ave
- 1265 E 15th Ave
- 1237 E 15th Ave
- 1231 E 15th Ave
- 1271 E 15th Ave
- 1256 E 15th Ave
- 1248 E 15th Ave
- 1260 E 15th Ave
- 1225 E 15th Ave
- 1275 E 15th Ave
- 1242 E 15th Ave
- 1238 E 15th Ave
- 1266 E 15th Ave
- 1221 E 15th Ave
- 1234 E 15th Ave
- 1272 E 15th Ave
- 1230 E 15th Ave
Your Personal Tour Guide
Ask me questions while you tour the home.