NOT LISTED FOR SALE

1249 Harbor Island Walk Baltimore, MD 21230

Riverside Neighborhood

Estimated Value: $1,071,389

4 Beds
4 Baths
3,388 Sq Ft
$316/Sq Ft Est. Value

Last Sold July 28, 2014

Last sale price $900,000 $266 Per Sq Ft

Est. 19% increase in value since last sale

Current estimated payment $7,818/month

About This Home

As of July 2014

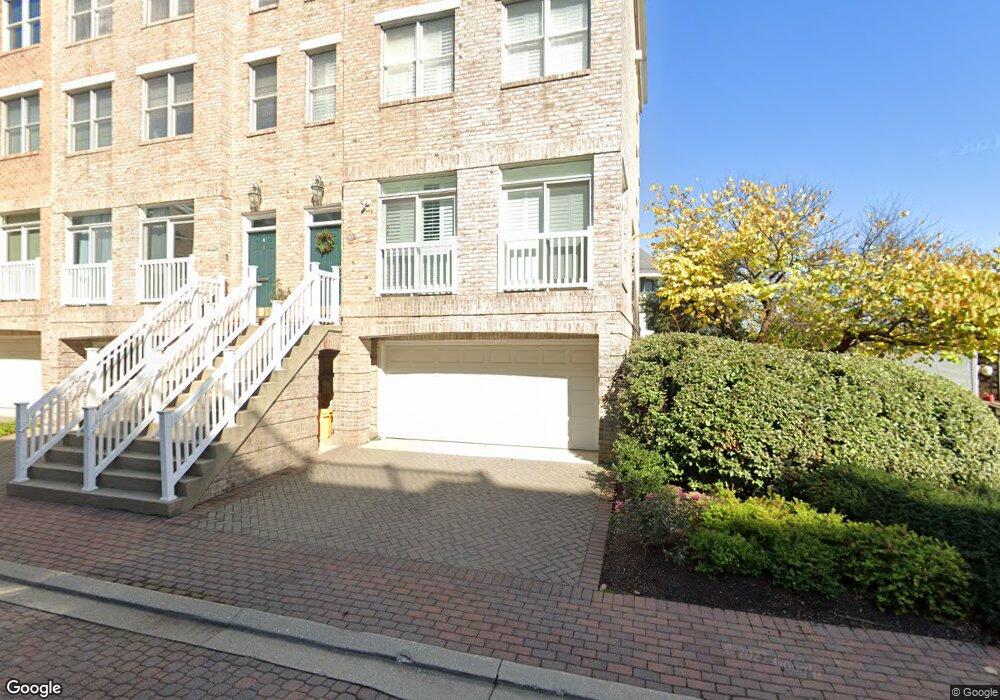
BEST VIEWS IN THE TOWNES AT HARBORVIEW! OPEN & BRIGHT EOG 5 LVL HOME W/4 BR, 3.5 BA, 2 WORKING FIREPLACES & WATER VIEWS FROM EACH FLOOR. 5-STOP ELEVATOR, WD FLOORS. GOURMET KIT W/CHERRY CAB, GRANITE COUNTERS & TERRACE. LARGE MASTER SUITE. 2 CAR GARAGE W/PARKING PAD. RECESSED LIGHTING. 4TH FLR FAMILY RM w FP. PENTHOUSE LVL W/WET BAR & DECK W/BREATH TAKING VIEWS. BEST OF DOWNTOWN LIVING.

Ownership History

Date Name Owned For Owner Type

Purchase Details

Listed on
May 18, 2014
Closed on
Jul 28, 2014
Sold by
Joyner John Russell and Joyner Rebecca
Bought by
Yiu Samuel C and Yiu Christine
Seller's Agent
James Baldwin
Compass
Buyer's Agent
Mary Widomski
Cummings & Co. Realtors
List Price
$959,000
Sold Price
$900,000
Premium/Discount to List
-$59,000
-6.15%
Current Estimated Value
$1,071,389

Home Financials for this Owner

Home Financials are based on the most recent Mortgage that was taken out on this home.
Estimated Appreciation
$171,389
Avg. Annual Appreciation
1.56%
Original Mortgage
$720,000
Outstanding Balance
$549,613
Interest Rate
4.14%
Mortgage Type
New Conventional
Estimated Equity
$521,776

Purchase Details

Closed on
Apr 12, 2001
Sold by
Harborview Limited Partnership
Bought by
Smith Paul D and Smith Sharon K
Source: Public Records

Range of Values:

Collateral Analytics

Collateral Analytics Collateral Analytics AVMs (Automated Valuation Model) employ a number of statistical approaches combined with neighborhood-specific comparable selection guarantees the most up-to-date and precise valuations.

Not Available

Collateral Analytics does not have data for the current month. Please view the chart for historical values.

ICE

ICE Mortgage Technology ICE Mortgage Technology’s AVM (Automated Valuation Model) is a state-of-the-art online residential property valuation tool that provides a quick and accurate estimate of the value of almost any home in the U.S.

Not Available

ICE Mortgage Technology does not have data for the current month. Please view the chart for historical values.

First American

First American First American Data & Analytics’ next-generation AVM combines unrivaled data assets with a blended ensemble of valuation models to produce highly accurate, reliable valuations you can trust.

Not Available

First American does not have data for the current month. Please view the chart for historical values.

Quantarium

Quantarium Quantarium’s valuation service, repeatedly proven the industry’s most accurate and comprehensive, is supercharged with a self-learning and auto-tuning AI engine that continually becomes smarter and more accurate as it processes daily inputs from the industry’s leading RE data lake.

Not Available

Quantarium does not have data for the current month. Please view the chart for historical values.

Average Value
Not Available
List Price
Sold Price
Create a Home Valuation Report for This Property
The Home Valuation Report is an in-depth analysis detailing your home's value as well as a comparison with similar homes in the area

Home Values in the Area

Source: Public Records

Average Home Value in this Area


Source: Public Records

Purchase History

Date Buyer Sale Price Title Company
Yiu Samuel C $900,000 None Available
Smith Paul D $764,672 --
Source: Public Records

Mortgage History

Date Status Borrower Loan Amount
Open Yiu Samuel C $720,000
Source: Public Records

Property History

Date Event Price List to Sale Price per Sq Ft Prior Sale
07/28/2014 07/28/14 Sold $900,000 -6.2% $266 / Sq Ft View Prior Sale
05/30/2014 05/30/14 Pending -- -- --
05/18/2014 05/18/14 For Sale $959,000 -- $283 / Sq Ft

Tax History Compared to Growth

Source: Public Records

Tax History

Year Tax Paid Tax Assessment Tax Assessment Total Assessment is a certain percentage of the fair market value that is determined by local assessors to be the total taxable value of land and additions on the property. Land Improvement
2025 $23,292 $1,114,800 -- --
2024 $23,292 $1,089,700 $0 $0
2023 $25,125 $1,064,600 $250,000 $814,600
2022 $24,270 $1,028,400 $0 $0
2021 $23,416 $992,200 $0 $0
2020 $20,564 $956,000 $250,000 $706,000
2019 $19,775 $949,333 $0 $0
2018 $19,301 $942,667 $0 $0
2017 $18,794 $936,000 $0 $0
2016 $20,343 $863,667 $0 $0
2015 $20,343 $791,333 $0 $0
2014 $20,343 $719,000 $0 $0
Source: Public Records

Agents Affiliated with this Home

  • Section Image
  • Section Image
  • Section Image
See All Agents

Map