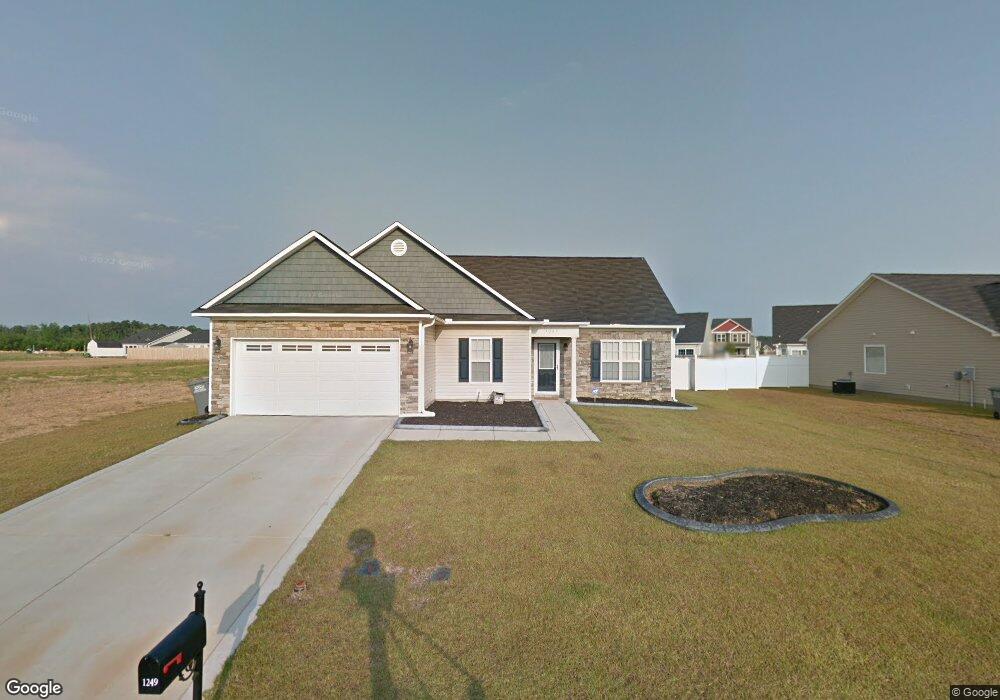
1249 St Johns Loop Raeford, NC 28376
Estimated Value: $269,961 - $289,000
3
Beds
2
Baths
1,563
Sq Ft
$177/Sq Ft
Est. Value
About This Home
This home is located at 1249 St Johns Loop, Raeford, NC 28376 and is currently estimated at $276,240, approximately $176 per square foot. 1249 St Johns Loop is a home located in Hoke County with nearby schools including Rockfish Hoke Elementary School, East Hoke Middle, and Hoke County High.
Ownership History
Date
Name
Owned For
Owner Type
Purchase Details
Closed on
Apr 4, 2025
Sold by
Korb Meghan Marie and Korb-Miller Meghan Marie
Bought by
Miller Chance Lee
Current Estimated Value
Purchase Details
Closed on
Dec 20, 2021
Sold by
James Adzima Michael and James Aleece Mackenzie
Bought by
Miller Chance and Korb Meghan Marie
Home Financials for this Owner
Home Financials are based on the most recent Mortgage that was taken out on this home.
Original Mortgage
$235,290
Interest Rate
3.12%
Mortgage Type
VA
Purchase Details
Closed on
Apr 29, 2011
Sold by
H H Constructors Inc
Bought by
H H Homes Of Fayetteville Llc
Home Financials for this Owner
Home Financials are based on the most recent Mortgage that was taken out on this home.
Original Mortgage
$163,337
Interest Rate
4.74%
Mortgage Type
VA
Create a Home Valuation Report for This Property
The Home Valuation Report is an in-depth analysis detailing your home's value as well as a comparison with similar homes in the area
Home Values in the Area
Average Home Value in this Area
Purchase History
| Date | Buyer | Sale Price | Title Company |
|---|---|---|---|
| Miller Chance Lee | -- | None Listed On Document | |
| Miller Chance Lee | -- | None Listed On Document | |
| Miller Chance | $230,000 | Lakhiani Law Pllc | |
| H H Homes Of Fayetteville Llc | -- | -- | |
| Adzima Michael James | $160,000 | -- |
Source: Public Records
Mortgage History
| Date | Status | Borrower | Loan Amount |
|---|---|---|---|
| Previous Owner | Miller Chance | $235,290 | |
| Previous Owner | Adzima Michael James | $163,337 |
Source: Public Records
Tax History
| Year | Tax Paid | Tax Assessment Tax Assessment Total Assessment is a certain percentage of the fair market value that is determined by local assessors to be the total taxable value of land and additions on the property. | Land | Improvement |
|---|---|---|---|---|
| 2025 | $1,782 | $203,970 | $40,000 | $163,970 |
| 2024 | $1,782 | $203,970 | $40,000 | $163,970 |
| 2023 | $1,782 | $203,970 | $40,000 | $163,970 |
| 2022 | $1,749 | $203,970 | $40,000 | $163,970 |
| 2021 | $1,455 | $162,930 | $25,000 | $137,930 |
| 2020 | $1,480 | $162,930 | $25,000 | $137,930 |
| 2019 | $1,480 | $162,930 | $25,000 | $137,930 |
| 2018 | $1,480 | $162,930 | $25,000 | $137,930 |
| 2017 | $1,480 | $162,930 | $25,000 | $137,930 |
| 2016 | $1,453 | $162,930 | $25,000 | $137,930 |
| 2015 | $1,453 | $162,930 | $25,000 | $137,930 |
| 2014 | $1,430 | $162,930 | $25,000 | $137,930 |
| 2013 | -- | $143,460 | $29,000 | $114,460 |
Source: Public Records
Map
Nearby Homes
- 188 Stockbridge Dr
- 219 Stockbridge Dr
- 151 Ivy Stone Dr
- 131 Emerywood Ct
- 202 Ivy Stone Dr
- 601 Collinwood Dr
- 505 Collinwood Dr
- 1093 Saint Johns Loop
- 1486 Saint Johns Loop
- 208 Lochwood Dr
- 196 Lochwood Dr
- 172 Collinwood Dr
- 273 Saint George Dr
- 626 Fairfield Cir
- 667 Saint Johns Loop
- 169 Eclipse Ct
- 521 Fairfield Cir
- 151 Huntington Dr
- 168 Bennington Dr
- 286 Sedgefield Dr
- 1249 Saint Johns Loop
- 1233 St John's Loop
- 1233 Saint Johns Loop
- 1269 Saint Johns Loop
- 1269 St Johns Loop
- 179 Stockbridge Dr
- 145 Stockbridge Dr
- 1217 St Johns Loop
- 1217 Saint Johns Loop
- 114 Crestwood Ln
- 191 Stockbridge Dr
- 119 Stockbridge Dr
- 1220 St John's Loop
- 1220 St John Loop S
- 1220 Saint Johns Loop
- 117 Crestwood Ln
- 1201 Saint Johns Loop
- 1201 St Johns Loop
- 205 Stockbridge Dr
- 1206 Saint Johns Loop
Your Personal Tour Guide
Ask me questions while you tour the home.