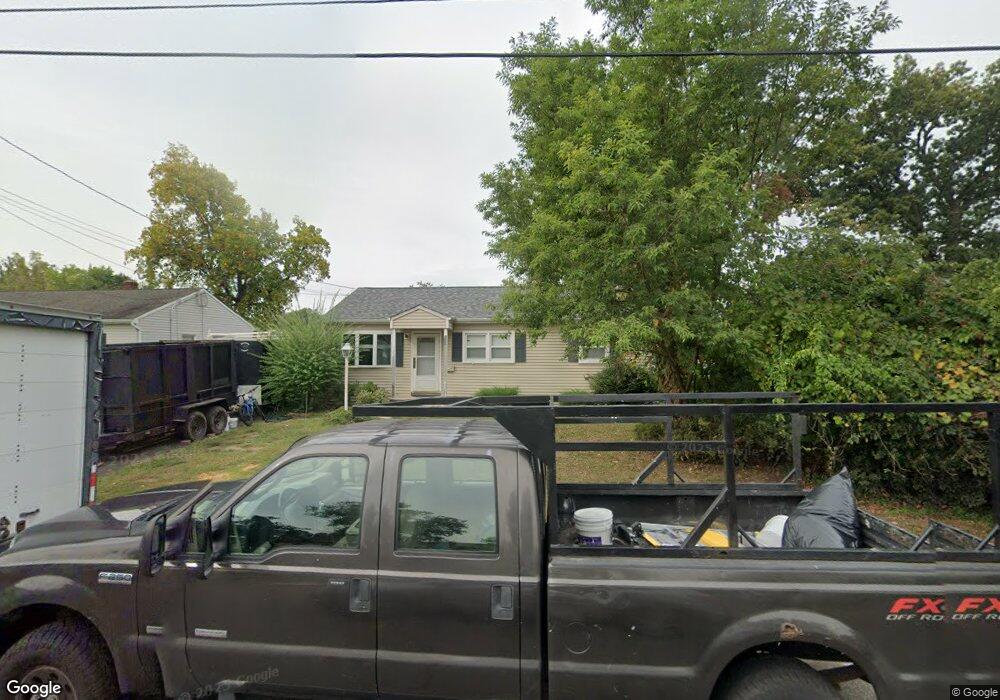
125 2nd St Middlesex, NJ 08846
Estimated Value: $350,000 - $402,000
3
Beds
1
Bath
912
Sq Ft
$418/Sq Ft
Est. Value
About This Home
This home is located at 125 2nd St, Middlesex, NJ 08846 and is currently estimated at $381,666, approximately $418 per square foot. 125 2nd St is a home located in Middlesex County with nearby schools including Middlesex High School and Our Lady of Mount Virgin School.
Ownership History
Date
Name
Owned For
Owner Type
Purchase Details
Closed on
Oct 30, 2009
Sold by
Lammond William G and Lammond Julia
Bought by
Moody Brian R
Current Estimated Value
Home Financials for this Owner
Home Financials are based on the most recent Mortgage that was taken out on this home.
Original Mortgage
$225,800
Outstanding Balance
$147,288
Interest Rate
4.98%
Mortgage Type
FHA
Estimated Equity
$234,378
Purchase Details
Closed on
Dec 31, 2002
Sold by
Mondero Melvin
Bought by
Lammond William
Home Financials for this Owner
Home Financials are based on the most recent Mortgage that was taken out on this home.
Original Mortgage
$142,400
Interest Rate
5.88%
Purchase Details
Closed on
Jun 29, 2001
Sold by
Coddington James
Bought by
Mondero Melvin and Mondero Cynthia
Home Financials for this Owner
Home Financials are based on the most recent Mortgage that was taken out on this home.
Original Mortgage
$157,528
Interest Rate
7.2%
Mortgage Type
FHA
Create a Home Valuation Report for This Property
The Home Valuation Report is an in-depth analysis detailing your home's value as well as a comparison with similar homes in the area
Home Values in the Area
Average Home Value in this Area
Purchase History
| Date | Buyer | Sale Price | Title Company |
|---|---|---|---|
| Moody Brian R | $248,000 | None Available | |
| Lammond William | $178,000 | -- | |
| Mondero Melvin | $160,000 | -- |
Source: Public Records
Mortgage History
| Date | Status | Borrower | Loan Amount |
|---|---|---|---|
| Open | Moody Brian R | $225,800 | |
| Previous Owner | Lammond William | $142,400 | |
| Previous Owner | Mondero Melvin | $157,528 |
Source: Public Records
Tax History
| Year | Tax Paid | Tax Assessment Tax Assessment Total Assessment is a certain percentage of the fair market value that is determined by local assessors to be the total taxable value of land and additions on the property. | Land | Improvement |
|---|---|---|---|---|
| 2025 | $6,923 | $339,700 | $124,200 | $215,500 |
| 2024 | $6,591 | $299,200 | $124,200 | $175,000 |
Source: Public Records
Map
Nearby Homes
Your Personal Tour Guide
Ask me questions while you tour the home.