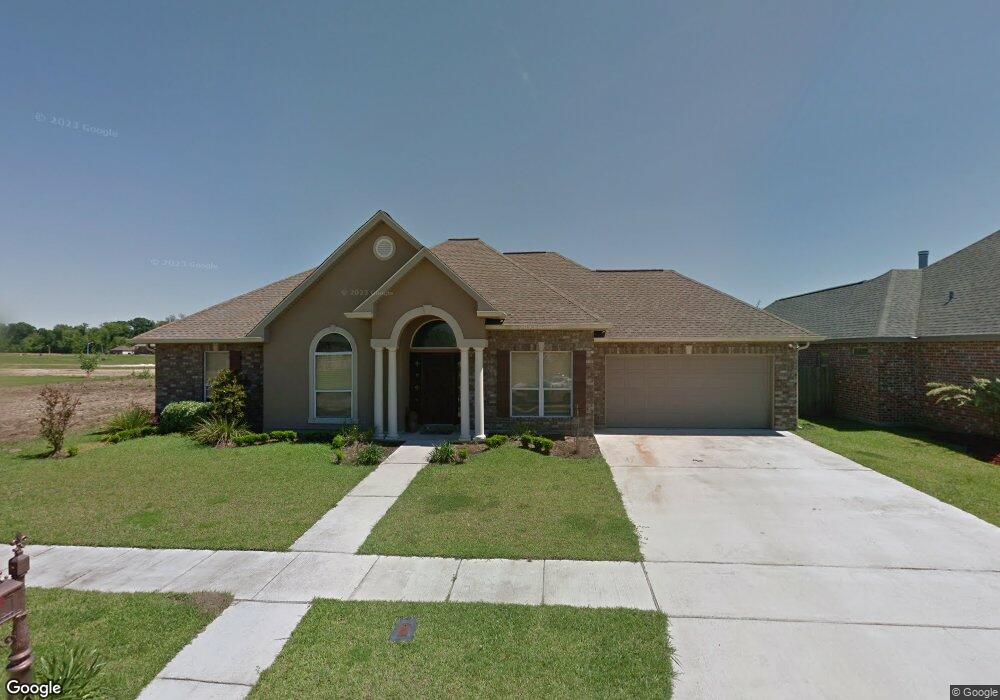
125 Allison Dr Luling, LA 70070
Estimated Value: $343,222 - $368,000
Studio
--
Bath
1,985
Sq Ft
$180/Sq Ft
Est. Value
About This Home
This home is located at 125 Allison Dr, Luling, LA 70070 and is currently estimated at $357,556, approximately $180 per square foot. 125 Allison Dr is a home located in St. Charles Parish with nearby schools including Mimosa Park Elementary School, Lakewood Elementary School, and J.B. Martin Middle School.
Ownership History
Date
Name
Owned For
Owner Type
Purchase Details
Closed on
Feb 24, 2022
Sold by
Roselie Kass Cindy
Bought by
Raines Tia Blanchard
Current Estimated Value
Home Financials for this Owner
Home Financials are based on the most recent Mortgage that was taken out on this home.
Original Mortgage
$213,750
Outstanding Balance
$183,291
Interest Rate
3.69%
Mortgage Type
New Conventional
Estimated Equity
$174,265
Purchase Details
Closed on
Apr 9, 2007
Sold by
Caillet Syl F
Bought by
Oestriecher Mary Briggs and Oestriecher Earl J
Home Financials for this Owner
Home Financials are based on the most recent Mortgage that was taken out on this home.
Original Mortgage
$53,400
Interest Rate
5.88%
Mortgage Type
Stand Alone Second
Create a Home Valuation Report for This Property
The Home Valuation Report is an in-depth analysis detailing your home's value as well as a comparison with similar homes in the area
Home Values in the Area
Average Home Value in this Area
Purchase History
| Date | Buyer | Sale Price | Title Company |
|---|---|---|---|
| Raines Tia Blanchard | -- | Rosenberg Lpa Llc | |
| Oestriecher Mary Briggs | $267,000 | Title Mart |
Source: Public Records
Mortgage History
| Date | Status | Borrower | Loan Amount |
|---|---|---|---|
| Open | Raines Tia Blanchard | $213,750 | |
| Previous Owner | Oestriecher Mary Briggs | $53,400 | |
| Previous Owner | Oestriecher Mary Briggs | $213,600 |
Source: Public Records
Tax History
| Year | Tax Paid | Tax Assessment Tax Assessment Total Assessment is a certain percentage of the fair market value that is determined by local assessors to be the total taxable value of land and additions on the property. | Land | Improvement |
|---|---|---|---|---|
| 2025 | $2,517 | $32,400 | $6,660 | $25,740 |
| 2024 | $2,517 | $32,400 | $6,660 | $25,740 |
| 2023 | $2,556 | $26,537 | $7,110 | $19,427 |
| 2022 | $3,103 | $26,537 | $7,110 | $19,427 |
| 2021 | $2,404 | $20,386 | $6,399 | $13,987 |
| 2020 | $3,135 | $26,537 | $7,110 | $19,427 |
| 2019 | $2,985 | $25,174 | $5,300 | $19,874 |
| 2018 | $2,962 | $25,174 | $5,300 | $19,874 |
| 2017 | $2,959 | $25,174 | $5,300 | $19,874 |
| 2016 | $2,971 | $25,174 | $5,300 | $19,874 |
| 2015 | $2,454 | $24,618 | $5,861 | $18,757 |
| 2014 | $2,753 | $24,299 | $5,861 | $18,438 |
| 2013 | $2,763 | $24,299 | $5,861 | $18,438 |
Source: Public Records
Map
Nearby Homes
- 127 Allison Dr
- 123 Allison Dr
- 422 Lakewood Dr
- 424 Lakewood Dr
- 420 Lakewood Dr
- 121 Allison Dr
- 129 Allison Dr
- 124 Allison Dr
- 126 Allison Dr
- 122 Allison Dr
- 426 Lakewood Dr
- 128 Allison Dr
- 418 Lakewood Dr
- 119 Allison Dr
- 130 Allison Dr
- 125 Braden Dr
- 120 Allison Dr
- 127 Braden Dr
- 0 S Lake Dr
- 416 Lakewood Dr
Your Personal Tour Guide
Ask me questions while you tour the home.