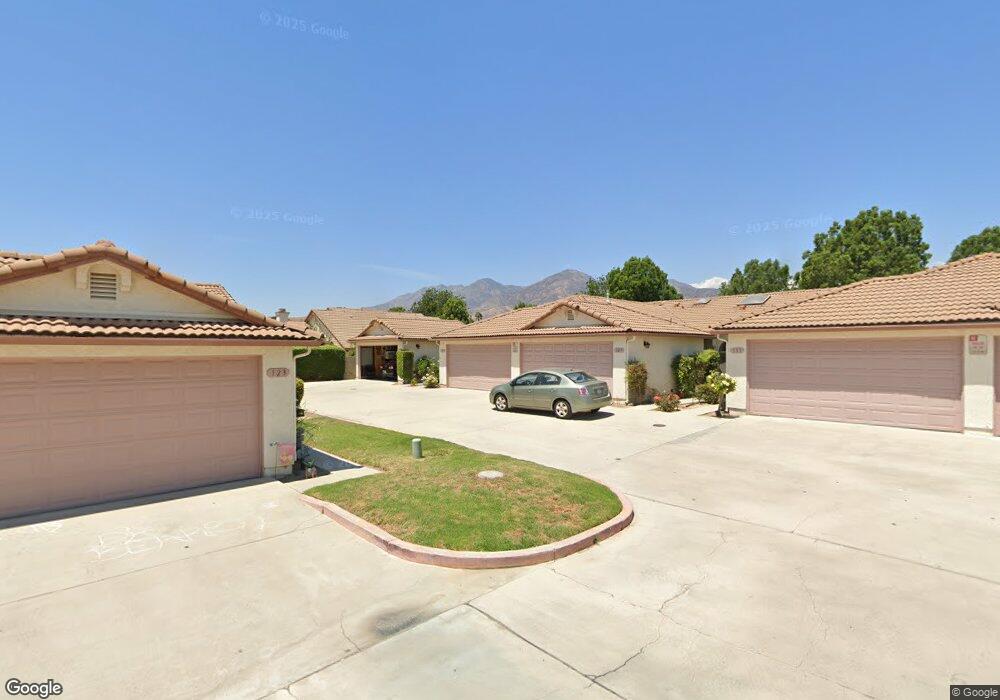
125 B St Fillmore, CA 93015
Estimated Value: $508,802 - $528,000
2
Beds
2
Baths
929
Sq Ft
$558/Sq Ft
Est. Value
About This Home
This home is located at 125 B St, Fillmore, CA 93015 and is currently estimated at $518,451, approximately $558 per square foot. 125 B St is a home located in Ventura County with nearby schools including Rio Vista Elementary School and Fillmore Senior High.
Ownership History
Date
Name
Owned For
Owner Type
Purchase Details
Closed on
Jan 2, 2008
Sold by
Gurrola Timothy S and Gurrola Amelia L
Bought by
Gurrola Timothy S and Gurrola Amelia L
Current Estimated Value
Purchase Details
Closed on
Jul 29, 1999
Sold by
Amelia L Gurrola David C Gurrola Timothy S
Bought by
Gurrola Timothy S and Gurrola Amelia L
Home Financials for this Owner
Home Financials are based on the most recent Mortgage that was taken out on this home.
Original Mortgage
$93,100
Interest Rate
7.56%
Create a Home Valuation Report for This Property
The Home Valuation Report is an in-depth analysis detailing your home's value as well as a comparison with similar homes in the area
Home Values in the Area
Average Home Value in this Area
Purchase History
| Date | Buyer | Sale Price | Title Company |
|---|---|---|---|
| Gurrola Timothy S | -- | None Available | |
| Gurrola Timothy S | $31,500 | American Title Co |
Source: Public Records
Mortgage History
| Date | Status | Borrower | Loan Amount |
|---|---|---|---|
| Closed | Gurrola Timothy S | $93,100 |
Source: Public Records
Tax History
| Year | Tax Paid | Tax Assessment Tax Assessment Total Assessment is a certain percentage of the fair market value that is determined by local assessors to be the total taxable value of land and additions on the property. | Land | Improvement |
|---|---|---|---|---|
| 2025 | $1,914 | $170,490 | $42,607 | $127,883 |
| 2024 | $1,914 | $167,148 | $41,772 | $125,376 |
| 2023 | $1,888 | $163,871 | $40,953 | $122,918 |
| 2022 | $1,747 | $160,658 | $40,150 | $120,508 |
| 2021 | $1,985 | $157,508 | $39,362 | $118,146 |
| 2020 | $1,843 | $155,895 | $38,959 | $116,936 |
| 2019 | $1,848 | $152,840 | $38,196 | $114,644 |
| 2018 | $1,811 | $149,845 | $37,448 | $112,397 |
| 2017 | $1,822 | $146,908 | $36,714 | $110,194 |
| 2016 | $1,688 | $144,029 | $35,995 | $108,034 |
| 2015 | $1,643 | $141,867 | $35,455 | $106,412 |
| 2014 | $1,641 | $139,090 | $34,761 | $104,329 |
Source: Public Records
Map
Nearby Homes
- 553 Grapefruit Ln
- 202 Avon Ln
- 222 Village Square
- 1112 Mockingbird Ln
- 1143 Los Serenos Dr
- 586 Apricot Ln
- 1120 1st St
- 534 Mulberry Ln
- 320 D St
- 1129 1st St
- 512 Mulberry Ln
- 553 Sespe Ave
- 445 Edgewood Dr
- 340 Central Ave
- 404 Central Ave
- 1401 Waterford Ln
- 300 Fillmore St
- 252 Driftwood St
- 444 Mountain View St
- 809 Woodgrove Rd
Your Personal Tour Guide
Ask me questions while you tour the home.