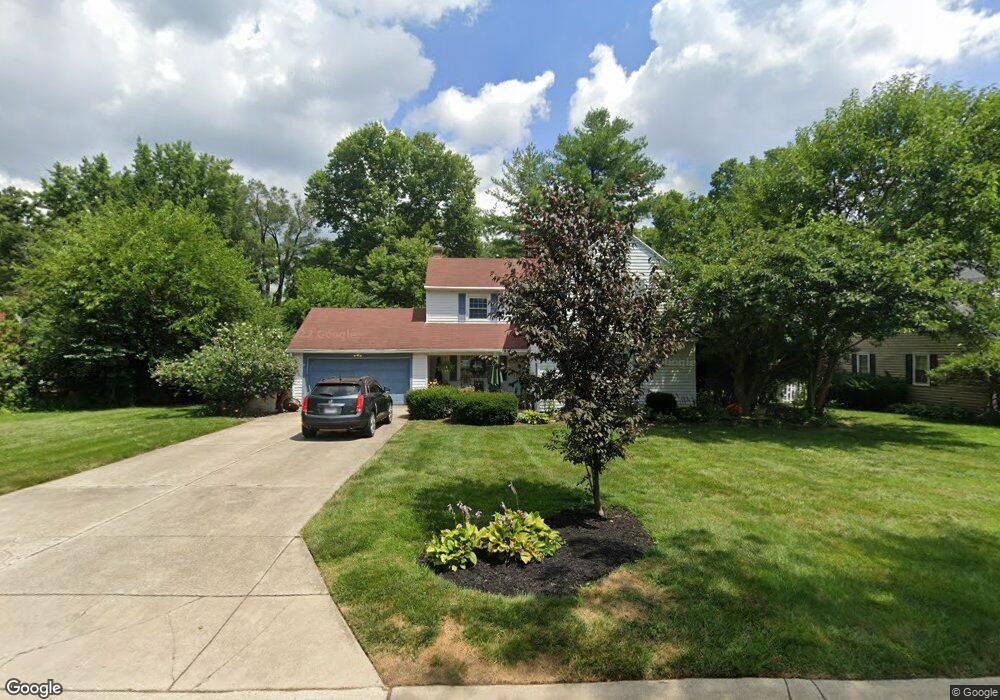
125 Balmoral Dr Dayton, OH 45429
Estimated Value: $285,000 - $324,000
3
Beds
2
Baths
1,544
Sq Ft
$197/Sq Ft
Est. Value
About This Home
This home is located at 125 Balmoral Dr, Dayton, OH 45429 and is currently estimated at $303,789, approximately $196 per square foot. 125 Balmoral Dr is a home located in Montgomery County with nearby schools including Southdale Elementary School, Van Buren Middle School, and Kettering Fairmont High School.
Ownership History
Date
Name
Owned For
Owner Type
Purchase Details
Closed on
Jul 24, 2019
Sold by
Huerta Cristina
Bought by
Vanderkaay Richard M and Vanderkaay Mary K
Current Estimated Value
Home Financials for this Owner
Home Financials are based on the most recent Mortgage that was taken out on this home.
Original Mortgage
$108,000
Outstanding Balance
$70,738
Interest Rate
3.73%
Mortgage Type
Future Advance Clause Open End Mortgage
Estimated Equity
$233,051
Purchase Details
Closed on
May 27, 2005
Sold by
Sky Joseph C and Sky Karen M
Bought by
Huerta Cristina
Purchase Details
Closed on
Jun 3, 2002
Sold by
Skardon Johnathan P and Skardon Amy L
Bought by
Sky Joseph C and Sky Karen M
Home Financials for this Owner
Home Financials are based on the most recent Mortgage that was taken out on this home.
Original Mortgage
$140,800
Interest Rate
6.25%
Purchase Details
Closed on
Jun 25, 1998
Sold by
Estate Of Kay M Gould
Bought by
Gould Willis W
Purchase Details
Closed on
Sep 7, 1993
Sold by
Gould Willis W
Bought by
Gould Kay M
Create a Home Valuation Report for This Property
The Home Valuation Report is an in-depth analysis detailing your home's value as well as a comparison with similar homes in the area
Home Values in the Area
Average Home Value in this Area
Purchase History
| Date | Buyer | Sale Price | Title Company |
|---|---|---|---|
| Vanderkaay Richard M | $135,000 | None Available | |
| Huerta Cristina | $202,000 | -- | |
| Sky Joseph C | $176,000 | -- | |
| Gould Willis W | -- | -- | |
| Gould Kay M | -- | -- |
Source: Public Records
Mortgage History
| Date | Status | Borrower | Loan Amount |
|---|---|---|---|
| Open | Vanderkaay Richard M | $108,000 | |
| Previous Owner | Sky Joseph C | $140,800 |
Source: Public Records
Tax History Compared to Growth
Tax History
| Year | Tax Paid | Tax Assessment Tax Assessment Total Assessment is a certain percentage of the fair market value that is determined by local assessors to be the total taxable value of land and additions on the property. | Land | Improvement |
|---|---|---|---|---|
| 2024 | $4,780 | $77,140 | $20,320 | $56,820 |
| 2023 | $4,780 | $77,140 | $20,320 | $56,820 |
| 2022 | $4,519 | $57,660 | $15,160 | $42,500 |
| 2021 | $4,179 | $57,660 | $15,160 | $42,500 |
| 2020 | $4,193 | $57,660 | $15,160 | $42,500 |
| 2019 | $4,166 | $50,670 | $14,440 | $36,230 |
| 2018 | $4,283 | $50,670 | $14,440 | $36,230 |
| 2017 | $3,930 | $50,670 | $14,440 | $36,230 |
| 2016 | $4,235 | $51,390 | $14,440 | $36,950 |
| 2015 | $4,048 | $51,390 | $14,440 | $36,950 |
| 2014 | $4,048 | $51,390 | $14,440 | $36,950 |
| 2012 | -- | $47,870 | $14,420 | $33,450 |
Source: Public Records
Map
Nearby Homes
- 298 Marchester Dr
- 305 Glenridge Rd
- 115 N Bromfield Rd
- 604 Schuyler Dr
- 4259 Maxlin Rd
- 3993 Applewood Ln
- 791 Willowdale Ave
- 645 Brookfield Rd
- 4241 Schrubb Dr
- 3212 Lenox Dr
- 3325 Ridgeway Rd
- 101 Blue Gate Cir Unit 1
- 804 Lovetta Dr
- 3822 Milford Dr
- 4808 Judith Dr
- 503 Cottingwood Ct
- 4816 Judith Dr
- 4824 Far Hills Ave
- 855 Brookfield Rd
- 117 Cushing Ave
- 141 Balmoral Dr
- 146 W Stroop Rd
- 117 Balmoral Dr
- 124 W Stroop Rd
- 118 Balmoral Dr
- 126 Balmoral Dr
- 110 Balmoral Dr
- 100 W Stroop Rd
- 172 W Stroop Rd
- 149 Balmoral Dr
- 134 Balmoral Dr
- 100 Balmoral Dr
- 101 Balmoral Dr
- 196 W Stroop Rd
- 117 Sherbrooke Dr
- 125 Sherbrooke Dr
- 4020 Elmridge Rd
- 142 Balmoral Dr
- 109 Sherbrooke Dr
- 133 Sherbrooke Dr