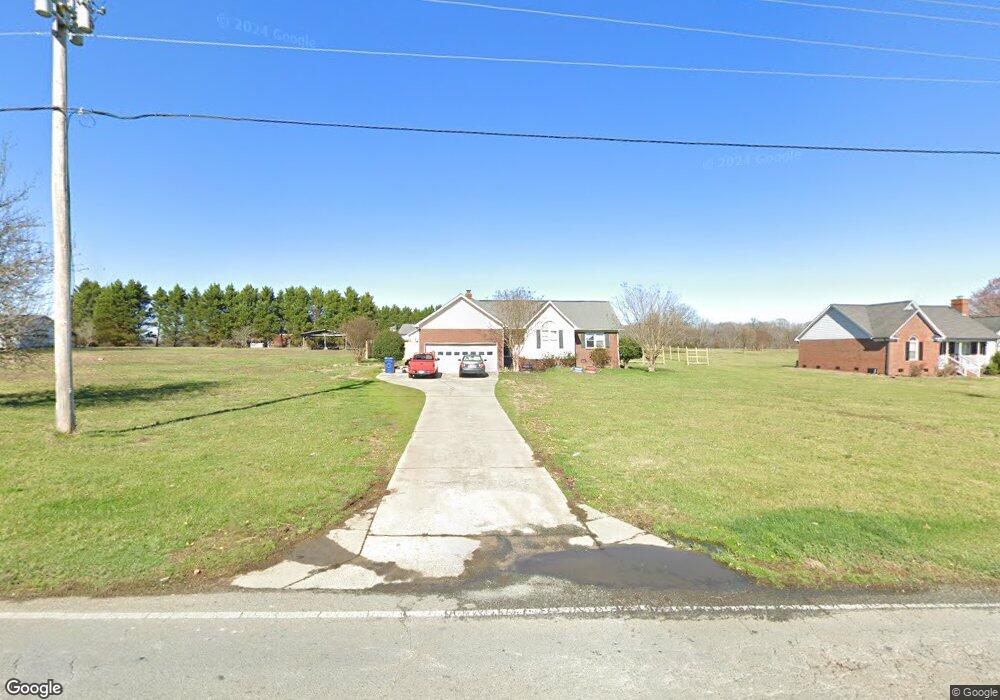
125 Baucom Deese Rd Monroe, NC 28110
Estimated Value: $412,000 - $482,000
3
Beds
2
Baths
1,808
Sq Ft
$246/Sq Ft
Est. Value
About This Home
This home is located at 125 Baucom Deese Rd, Monroe, NC 28110 and is currently estimated at $444,338, approximately $245 per square foot. 125 Baucom Deese Rd is a home located in Union County with nearby schools including Unionville Elementary School, Piedmont Middle School, and Piedmont High School.
Ownership History
Date
Name
Owned For
Owner Type
Purchase Details
Closed on
Apr 4, 2017
Sold by
Capote Peregrino David Nicasio and Capote Palacios Patricia
Bought by
Nicasio Patricia and Capote Antonio Palacio
Current Estimated Value
Home Financials for this Owner
Home Financials are based on the most recent Mortgage that was taken out on this home.
Original Mortgage
$134,700
Outstanding Balance
$111,132
Interest Rate
4.16%
Mortgage Type
New Conventional
Estimated Equity
$333,206
Purchase Details
Closed on
Feb 28, 2012
Sold by
Taylor Wade H
Bought by
Capote Peregrino David Nicasio and Capote Palacios Patricia
Home Financials for this Owner
Home Financials are based on the most recent Mortgage that was taken out on this home.
Original Mortgage
$137,750
Interest Rate
3.91%
Mortgage Type
New Conventional
Purchase Details
Closed on
Mar 9, 1998
Sold by
Carelock Kimberly S and Carelock Kelly
Bought by
Taylor Wade H and Taylor Virginia G
Create a Home Valuation Report for This Property
The Home Valuation Report is an in-depth analysis detailing your home's value as well as a comparison with similar homes in the area
Home Values in the Area
Average Home Value in this Area
Purchase History
| Date | Buyer | Sale Price | Title Company |
|---|---|---|---|
| Nicasio Patricia | -- | Attorneys Title Agency | |
| Capote Peregrino David Nicasio | $145,000 | None Available | |
| Taylor Wade H | $140,000 | -- |
Source: Public Records
Mortgage History
| Date | Status | Borrower | Loan Amount |
|---|---|---|---|
| Open | Nicasio Patricia | $134,700 | |
| Previous Owner | Capote Peregrino David Nicasio | $137,750 |
Source: Public Records
Tax History
| Year | Tax Paid | Tax Assessment Tax Assessment Total Assessment is a certain percentage of the fair market value that is determined by local assessors to be the total taxable value of land and additions on the property. | Land | Improvement |
|---|---|---|---|---|
| 2025 | $2,168 | $426,700 | $0 | $0 |
| 2024 | $1,624 | $240,400 | $40,500 | $199,900 |
| 2023 | $1,609 | $240,400 | $40,500 | $199,900 |
| 2022 | $1,561 | $240,400 | $40,500 | $199,900 |
| 2021 | $1,610 | $240,400 | $40,500 | $199,900 |
| 2020 | $1,483 | $191,100 | $24,100 | $167,000 |
| 2019 | $1,535 | $191,100 | $24,100 | $167,000 |
| 2018 | $1,497 | $191,100 | $24,100 | $167,000 |
| 2017 | $1,592 | $191,100 | $24,100 | $167,000 |
| 2016 | $1,565 | $191,100 | $24,100 | $167,000 |
| 2015 | $1,584 | $191,100 | $24,100 | $167,000 |
| 2014 | -- | $185,720 | $30,100 | $155,620 |
Source: Public Records
Map
Nearby Homes
- 127 Martin Ridge Dr Unit 7
- 123 Martin Ridge Dr Unit 5
- 411 Baucom Deese Rd
- 345 Willowsford Dr
- 2823 Aubrey St Unit 94
- 2744 Trinity St
- 2635 Concord Hwy
- 509 Baucom Deese Rd
- 1823 Quiet Woods Rd
- 1804 Quiet Woods Rd
- 1800 Quiet Woods Rd
- 333 Knotty Woods Dr
- 1913 Quiet Woods Rd
- 2305 Quiet Woods Rd
- 330 Maidstone Dr
- 611 Baucom Deese Rd
- 916 Fowler Rd
- 2556 Blue Sky Meadows Dr
- 2612 Blue Sky Meadows Dr
- 2616 Blue Sky Meadows Dr
- 201 Baucom Deese Rd
- 203 Baucom Deese Rd
- 121 Baucom Deese Rd
- 2914 Concord Hwy
- 205 Baucom Deese Rd
- 2912 Concord Hwy
- 207 Baucom Deese Rd
- 209 Baucom Deese Rd
- 107 Baucom Deese Rd
- 112 Baucom Deese Rd
- 2908 Concord Hwy
- 120 Baucom Deese Rd
- 211 Baucom Deese Rd
- 2830 Concord Hwy
- Lot #3 Baucom Deese Rd Unit 3
- 2911 Cardinal Landing Dr
- 114 Baucom Deese Rd
- 2909 Cardinal Landing Dr
- 124 Baucom Deese Rd
- 223 Baucom Deese Rd
Your Personal Tour Guide
Ask me questions while you tour the home.