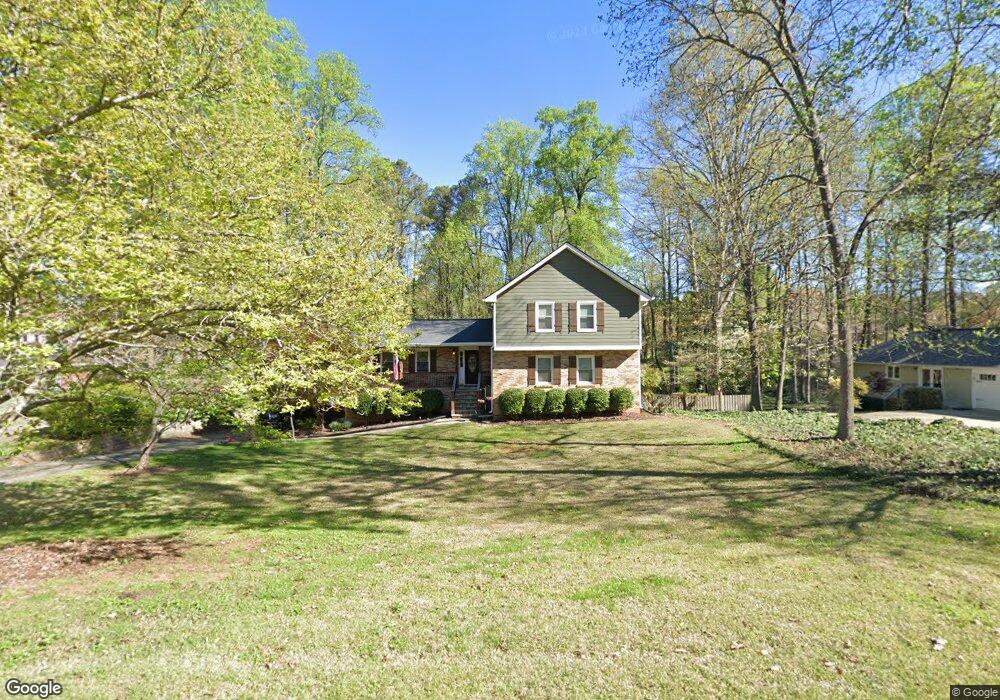
125 Beechwood Trail Unit 2 Roswell, GA 30075
Estimated Value: $601,825 - $697,000
4
Beds
3
Baths
1,599
Sq Ft
$406/Sq Ft
Est. Value
About This Home
This home is located at 125 Beechwood Trail Unit 2, Roswell, GA 30075 and is currently estimated at $649,456, approximately $406 per square foot. 125 Beechwood Trail Unit 2 is a home located in Fulton County with nearby schools including Sweet Apple Elementary School, Elkins Pointe Middle School, and Fulton Academy of Science and Technology.
Ownership History
Date
Name
Owned For
Owner Type
Purchase Details
Closed on
Jul 26, 2005
Sold by
Wood Christopher C and Wood Dana
Bought by
Hammond Robert M and Hammond Mary
Current Estimated Value
Home Financials for this Owner
Home Financials are based on the most recent Mortgage that was taken out on this home.
Original Mortgage
$195,600
Outstanding Balance
$101,693
Interest Rate
5.5%
Mortgage Type
New Conventional
Estimated Equity
$547,763
Purchase Details
Closed on
Sep 18, 2003
Sold by
Zych Robin G and Zych Anthony S
Bought by
Wood Christopher C
Home Financials for this Owner
Home Financials are based on the most recent Mortgage that was taken out on this home.
Original Mortgage
$174,000
Interest Rate
4.63%
Mortgage Type
New Conventional
Purchase Details
Closed on
Sep 29, 1998
Sold by
Hopkins Helen S
Bought by
Winston Peter M
Home Financials for this Owner
Home Financials are based on the most recent Mortgage that was taken out on this home.
Original Mortgage
$158,100
Interest Rate
6.8%
Mortgage Type
New Conventional
Create a Home Valuation Report for This Property
The Home Valuation Report is an in-depth analysis detailing your home's value as well as a comparison with similar homes in the area
Home Values in the Area
Average Home Value in this Area
Purchase History
| Date | Buyer | Sale Price | Title Company |
|---|---|---|---|
| Hammond Robert M | $244,500 | -- | |
| Wood Christopher C | $217,500 | -- | |
| Winston Peter M | $155,000 | -- |
Source: Public Records
Mortgage History
| Date | Status | Borrower | Loan Amount |
|---|---|---|---|
| Open | Hammond Robert M | $195,600 | |
| Previous Owner | Wood Christopher C | $174,000 | |
| Previous Owner | Winston Peter M | $158,100 |
Source: Public Records
Tax History Compared to Growth
Tax History
| Year | Tax Paid | Tax Assessment Tax Assessment Total Assessment is a certain percentage of the fair market value that is determined by local assessors to be the total taxable value of land and additions on the property. | Land | Improvement |
|---|---|---|---|---|
| 2025 | $585 | $181,960 | $48,760 | $133,200 |
| 2023 | $5,426 | $192,240 | $60,600 | $131,640 |
| 2022 | $2,256 | $154,320 | $41,600 | $112,720 |
| 2021 | $2,671 | $133,560 | $29,240 | $104,320 |
| 2020 | $2,705 | $112,200 | $26,600 | $85,600 |
| 2019 | $438 | $110,200 | $26,120 | $84,080 |
| 2018 | $2,582 | $107,640 | $25,520 | $82,120 |
| 2017 | $2,094 | $83,720 | $16,240 | $67,480 |
| 2016 | $2,093 | $83,720 | $16,240 | $67,480 |
| 2015 | $2,558 | $83,720 | $16,240 | $67,480 |
| 2014 | $1,764 | $70,280 | $13,640 | $56,640 |
Source: Public Records
Map
Nearby Homes
- 11850 Chaffin Rd
- 345 Chaffin Ridge Ct
- 600 Rounsaville Rd
- 2230 Ashton Dr
- 125 Fortuna Ct
- 5022 Towneship Creek Rd
- 4404 Orchard Trace
- 1115 Primrose Dr
- 1000 Sterling Ct
- 220 Hollyberry Dr
- 220 Hollyberry Ct
- 120 Gala Ct
- 5000 Lexington Dr
- 530 Camber Woods Dr
- 680 Brookfield Pkwy Unit 1
- 1012 Towneship Way
- 1002 Towneship Way
- 565 Camber Woods Dr
- 515 Kent Rd
- 135 Beechwood Trail Unit 2
- 210 Thistlewood Ln
- 105 Beechwood Trail Unit 2
- 11700 Northgate Trail
- 145 Beechwood Trail
- 120 Beechwood Trail
- 200 Thistlewood Ln Unit 2
- 220 Thistlewood Ln
- 130 Beechwood Trail
- 110 Beechwood Trail
- 11710 Northgate Trail
- 140 Beechwood Trail
- 100 Beechwood Trail
- 190 Thistlewood Ln
- 11695 Northgate Trail
- 11705 Northgate Trail
- 11800 Hardscrabble Trail
- 11720 Northgate Trail
- 11685 Northgate Trail
- 11685 Northgate Trail