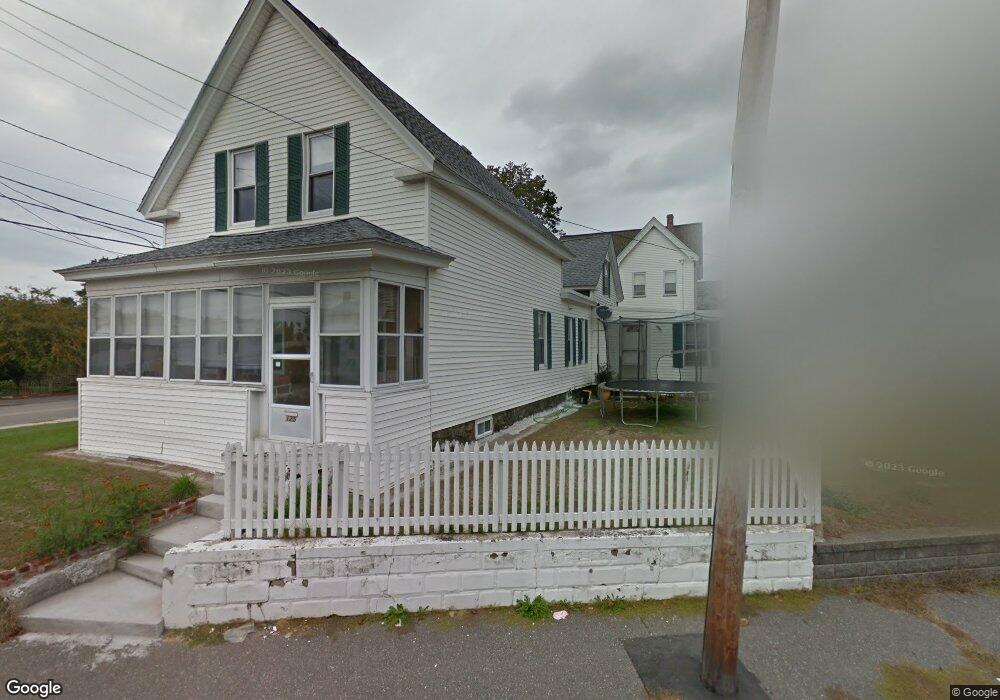
125 Billings St Lowell, MA 01850
Centralville NeighborhoodEstimated Value: $440,000 - $566,000
3
Beds
1
Bath
1,398
Sq Ft
$350/Sq Ft
Est. Value
About This Home
This home is located at 125 Billings St, Lowell, MA 01850 and is currently estimated at $489,096, approximately $349 per square foot. 125 Billings St is a home located in Middlesex County with nearby schools including Greenhalge Elementary School, S. Christa McAuliffe Elementary School, and Moody Elementary School.
Ownership History
Date
Name
Owned For
Owner Type
Purchase Details
Closed on
Apr 24, 2024
Sold by
Pisith Botum
Bought by
Keo Yeeka
Current Estimated Value
Home Financials for this Owner
Home Financials are based on the most recent Mortgage that was taken out on this home.
Original Mortgage
$209,000
Outstanding Balance
$205,793
Interest Rate
6.74%
Mortgage Type
Stand Alone Refi Refinance Of Original Loan
Estimated Equity
$283,303
Purchase Details
Closed on
May 31, 2016
Sold by
Keo Chintana and Keo Savda
Bought by
Keo Yeeka and Pisith Botum
Home Financials for this Owner
Home Financials are based on the most recent Mortgage that was taken out on this home.
Original Mortgage
$235,653
Interest Rate
3.25%
Mortgage Type
FHA
Purchase Details
Closed on
Oct 10, 2002
Sold by
Prinos Mary J and Prinos Christopher
Bought by
Keo Chintana and Keo Savda
Home Financials for this Owner
Home Financials are based on the most recent Mortgage that was taken out on this home.
Original Mortgage
$200,592
Interest Rate
6.24%
Mortgage Type
Purchase Money Mortgage
Create a Home Valuation Report for This Property
The Home Valuation Report is an in-depth analysis detailing your home's value as well as a comparison with similar homes in the area
Home Values in the Area
Average Home Value in this Area
Purchase History
| Date | Buyer | Sale Price | Title Company |
|---|---|---|---|
| Keo Yeeka | -- | None Available | |
| Keo Yeeka | -- | None Available | |
| Keo Yeeka | $240,000 | -- | |
| Keo Chintana | $211,150 | -- | |
| Keo Yeeka | $240,000 | -- | |
| Keo Chintana | $211,150 | -- |
Source: Public Records
Mortgage History
| Date | Status | Borrower | Loan Amount |
|---|---|---|---|
| Open | Keo Yeeka | $209,000 | |
| Closed | Keo Yeeka | $209,000 | |
| Previous Owner | Keo Yeeka | $235,653 | |
| Previous Owner | Keo Chintana | $200,592 |
Source: Public Records
Tax History Compared to Growth
Tax History
| Year | Tax Paid | Tax Assessment Tax Assessment Total Assessment is a certain percentage of the fair market value that is determined by local assessors to be the total taxable value of land and additions on the property. | Land | Improvement |
|---|---|---|---|---|
| 2025 | $5,016 | $436,900 | $133,900 | $303,000 |
| 2024 | $4,986 | $418,600 | $133,100 | $285,500 |
| 2023 | $4,697 | $378,200 | $115,700 | $262,500 |
| 2022 | $4,416 | $348,000 | $105,200 | $242,800 |
| 2021 | $4,117 | $305,900 | $91,500 | $214,400 |
| 2020 | $3,725 | $278,800 | $75,200 | $203,600 |
| 2019 | $3,354 | $238,900 | $60,400 | $178,500 |
| 2018 | $3,278 | $227,800 | $57,500 | $170,300 |
| 2017 | $3,085 | $206,800 | $45,000 | $161,800 |
| 2016 | $2,742 | $180,900 | $48,400 | $132,500 |
Source: Public Records
Map
Nearby Homes
- 345 Hildreth St Unit 14
- 349 Hildreth St Unit 16
- 25 Dana St
- 130 Farmland Rd
- 375 Aiken Ave Unit 4
- 375 Aiken Ave Unit 1
- 190 Ennell St
- 87 Exeter St
- 972 Bridge St
- 47 Whitney Ave
- 12 Fisher St
- 126 Willard St Unit J
- 34 May St
- 18 May St
- 37 Campaw St
- 37 Beaudry St
- 45 July St
- 18 Stone St
- 149 Methuen St
- 98 Pemberton St Unit 23
- 119 Billings St
- 253 Aiken Ave
- 124 Billings St
- 261 Aiken Ave
- 114 Billings St
- 246 Aiken Ave Unit 9
- 246 Aiken Ave Unit 8
- 246 Aiken Ave Unit 7
- 246 Aiken Ave Unit 6
- 246 Aiken Ave Unit 5
- 246 Aiken Ave Unit 4
- 246 Aiken Ave Unit 3
- 246 Aiken Ave Unit 2
- 246 Aiken Ave Unit 1
- 105 Billings St
- 344 Rear Aiken Ave
- 231 Aiken Ave
- 106 Billings St
- 265 Aiken Ave
- 265 Aiken Ave Unit 2