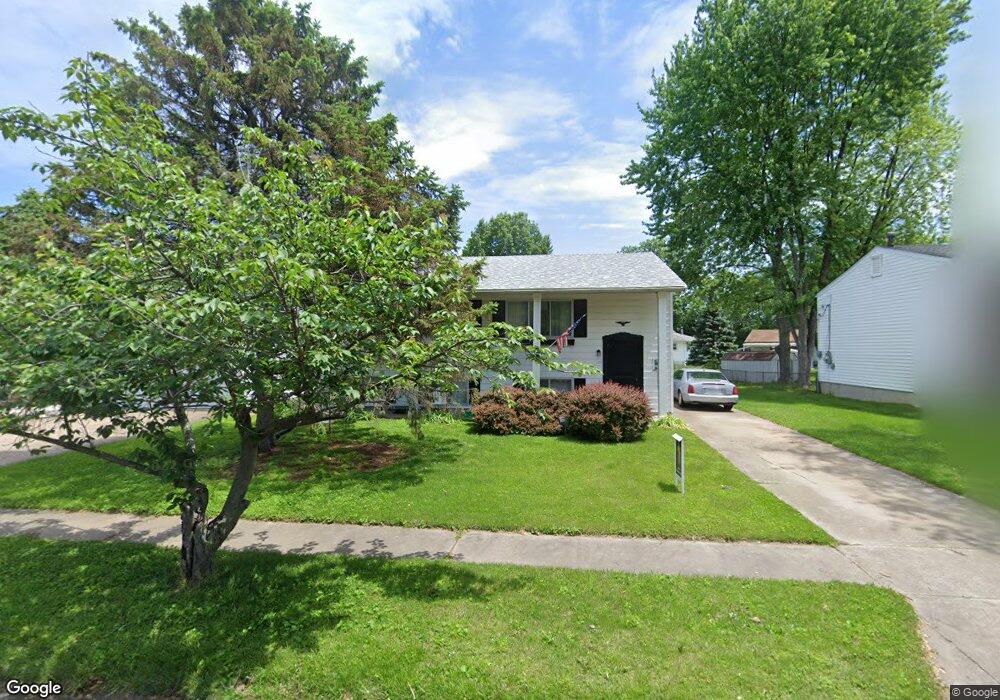
125 Brower Dr Florissant, MO 63031
Estimated Value: $155,447 - $175,000
3
Beds
1
Bath
1,064
Sq Ft
$158/Sq Ft
Est. Value
About This Home
This home is located at 125 Brower Dr, Florissant, MO 63031 and is currently estimated at $168,362, approximately $158 per square foot. 125 Brower Dr is a home located in St. Louis County with nearby schools including Combs Elementary School, Cross Keys Middle School, and McCluer North High School.
Ownership History
Date
Name
Owned For
Owner Type
Purchase Details
Closed on
Aug 5, 2019
Sold by
Hasenfratz Donald J
Bought by
Hasenfratz Donald J and Donald J Hasenfratz Living Trust
Current Estimated Value
Purchase Details
Closed on
Jan 28, 2003
Sold by
Hasenfratz Donald J and Hasenfratz Lois L
Bought by
Hasenfratz Carolyn M and Hasenfratz Lawrence J
Create a Home Valuation Report for This Property
The Home Valuation Report is an in-depth analysis detailing your home's value as well as a comparison with similar homes in the area
Home Values in the Area
Average Home Value in this Area
Purchase History
| Date | Buyer | Sale Price | Title Company |
|---|---|---|---|
| Hasenfratz Donald J | -- | None Available | |
| Hasenfratz Carolyn M | -- | -- |
Source: Public Records
Tax History Compared to Growth
Tax History
| Year | Tax Paid | Tax Assessment Tax Assessment Total Assessment is a certain percentage of the fair market value that is determined by local assessors to be the total taxable value of land and additions on the property. | Land | Improvement |
|---|---|---|---|---|
| 2025 | $1,971 | $28,840 | $4,540 | $24,300 |
| 2024 | $1,971 | $25,370 | $3,140 | $22,230 |
| 2023 | $1,964 | $25,370 | $3,140 | $22,230 |
| 2022 | $1,759 | $19,930 | $4,540 | $15,390 |
| 2021 | $1,729 | $19,930 | $4,540 | $15,390 |
| 2020 | $1,530 | $16,590 | $4,010 | $12,580 |
| 2019 | $1,500 | $16,590 | $4,010 | $12,580 |
| 2018 | $1,482 | $14,640 | $2,190 | $12,450 |
| 2017 | $1,474 | $14,640 | $2,190 | $12,450 |
| 2016 | $1,536 | $14,880 | $2,570 | $12,310 |
| 2015 | $1,656 | $15,970 | $2,570 | $13,400 |
| 2014 | $1,517 | $15,080 | $3,950 | $11,130 |
Source: Public Records
Map
Nearby Homes
- 937 Cades Cove
- 201 Brower Ln
- 216 Graham Rd
- 279 Elmdale Ct
- 630 Graham Rd
- 7731 Hazelcrest Dr Unit H
- 7641 Hazelcrest Dr Unit 47
- 200 Calbreath Ct
- 7594 Hazelcrest Dr Unit B
- 540 S Jefferson St
- 15 Henson Ln
- 580 Saint Marie St
- 655 Florland Dr
- 305 S Lafayette St
- 7520 Hazelcrest Dr Unit 227
- 710 Thompson Dr
- 7497 Hazelcrest Dr Unit F
- 260 N Jefferson St
- 305 Sturbridge Village Dr Unit 6B
- 700 Kostka Ln
- 135 Brower Dr
- 115 Brower Dr
- 345 S Saint Charles St
- 335 S Saint Charles St
- 145 Brower Ct
- 105 Brower Ln
- 155 Brower Ct
- 325 S Saint Charles St
- 120 Brower Dr
- 130 Brower Dr
- 315 S Saint Charles St
- 1 Brower Ln
- 140 Brower Dr
- 375 S Saint Charles St
- 2 Brower Ln
- 165 Brower Ct
- 305 S Saint Charles St
- 150 Brower Dr
- 3 Brower Ln
- 385 S Saint Charles St