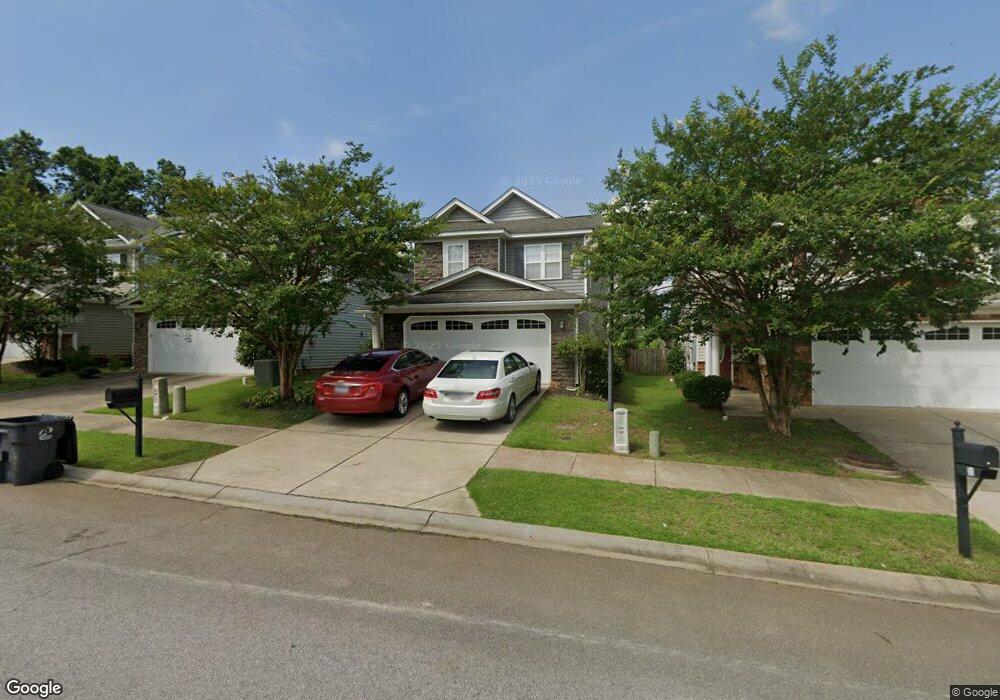
125 Caley Ct Lexington, SC 29072
Estimated Value: $287,000 - $302,000
3
Beds
1
Bath
1,949
Sq Ft
$151/Sq Ft
Est. Value
About This Home
This home is located at 125 Caley Ct, Lexington, SC 29072 and is currently estimated at $294,161, approximately $150 per square foot. 125 Caley Ct is a home located in Lexington County with nearby schools including Meadow Glen Elementary, Meadow Glen Middle School, and River Bluff High School.
Ownership History
Date
Name
Owned For
Owner Type
Purchase Details
Closed on
Dec 14, 2021
Sold by
Vsp Charlotte Llc
Bought by
Diversified Residential Homes 3 Llc
Current Estimated Value
Purchase Details
Closed on
May 27, 2021
Sold by
Owen Matthew C and Owen Jessica L
Bought by
Vsp Charlotte Llc
Purchase Details
Closed on
Jan 29, 2018
Sold by
Ryan Elizabeth M
Bought by
Owen Matthew C and Owen Jessica L
Home Financials for this Owner
Home Financials are based on the most recent Mortgage that was taken out on this home.
Original Mortgage
$174,705
Interest Rate
3.93%
Mortgage Type
New Conventional
Purchase Details
Closed on
Sep 15, 2009
Sold by
Hurricane Construction Inc
Bought by
Ryan Elizabeth M
Home Financials for this Owner
Home Financials are based on the most recent Mortgage that was taken out on this home.
Original Mortgage
$151,093
Interest Rate
5.11%
Mortgage Type
FHA
Create a Home Valuation Report for This Property
The Home Valuation Report is an in-depth analysis detailing your home's value as well as a comparison with similar homes in the area
Home Values in the Area
Average Home Value in this Area
Purchase History
| Date | Buyer | Sale Price | Title Company |
|---|---|---|---|
| Diversified Residential Homes 3 Llc | $969,312 | None Available | |
| Vsp Charlotte Llc | $208,000 | None Available | |
| Owen Matthew C | $184,900 | None Available | |
| Ryan Elizabeth M | $164,995 | -- |
Source: Public Records
Mortgage History
| Date | Status | Borrower | Loan Amount |
|---|---|---|---|
| Previous Owner | Owen Matthew C | $174,705 | |
| Previous Owner | Ryan Elizabeth M | $151,093 |
Source: Public Records
Tax History
| Year | Tax Paid | Tax Assessment Tax Assessment Total Assessment is a certain percentage of the fair market value that is determined by local assessors to be the total taxable value of land and additions on the property. | Land | Improvement |
|---|---|---|---|---|
| 2024 | $7,813 | $14,400 | $2,100 | $12,300 |
| 2023 | $7,516 | $14,400 | $2,100 | $12,300 |
| 2022 | $7,242 | $14,400 | $2,100 | $12,300 |
| 2020 | $1,316 | $7,360 | $1,400 | $5,960 |
| 2019 | $1,397 | $7,356 | $1,400 | $5,956 |
| 2018 | $1,142 | $6,107 | $1,000 | $5,107 |
| 2017 | $1,114 | $6,107 | $1,000 | $5,107 |
| 2016 | $1,106 | $6,106 | $1,000 | $5,106 |
| 2014 | $1,158 | $6,599 | $1,400 | $5,199 |
| 2013 | -- | $6,600 | $1,400 | $5,200 |
Source: Public Records
Map
Nearby Homes
- 216 Ashmore Ln
- 312 Ashmore Ln
- 116 Tolbert St
- 108 Black Walnut Dr
- 4801 Sunset Blvd Unit 125
- 111 Crepe Myrtle Cir
- 124 Park Place Ct
- 105 May Morning Ct
- 4901 Sunset Blvd Unit 303
- 4901 Sunset Blvd Unit 323
- 291 Big Timber Dr
- 139 Timbergate Dr
- 108 Snow Ln
- 0 Roper Mountain Ct Unit 613841
- 238 Cromer Rd
- 0 Mineral Springs Rd Unit 560120
- 0 English Dr Unit 623795
- 139 Dark Hollow Dr
- 146 River Bridge Ln
- 517 Fourteen Mile Ln
Your Personal Tour Guide
Ask me questions while you tour the home.