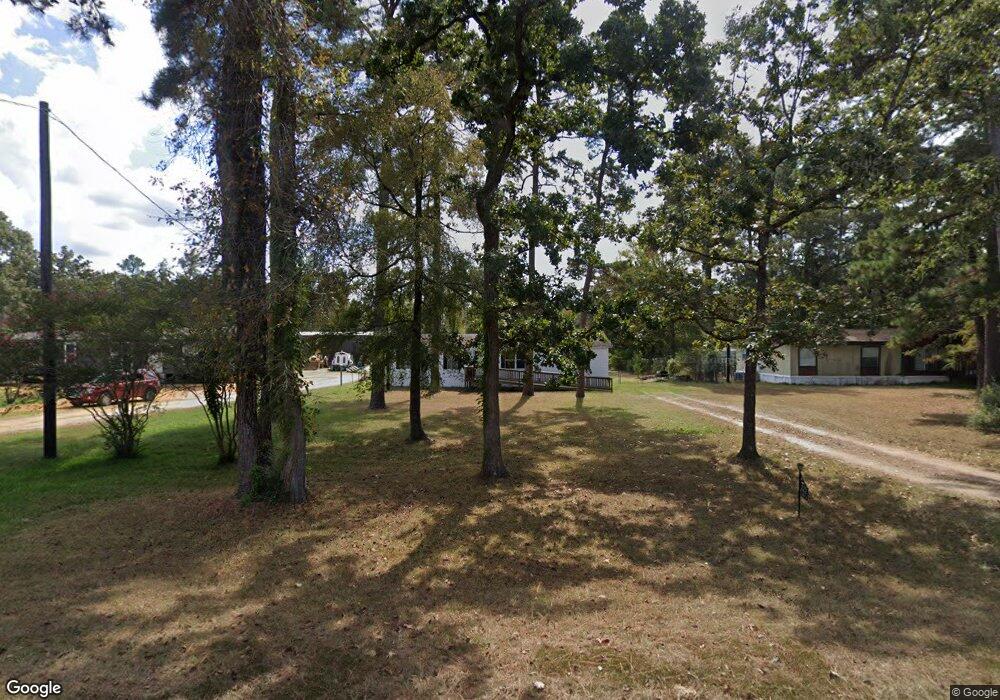
125 Cedar Ct Magnolia, TX 77355
Estimated Value: $234,000 - $281,930
4
Beds
2
Baths
1,216
Sq Ft
$208/Sq Ft
Est. Value
About This Home
This home is located at 125 Cedar Ct, Magnolia, TX 77355 and is currently estimated at $252,733, approximately $207 per square foot. 125 Cedar Ct is a home located in Waller County with nearby schools including Fields Store Elementary School, Schultz Junior High School, and Waller High School.
Ownership History
Date
Name
Owned For
Owner Type
Purchase Details
Closed on
Feb 8, 2013
Sold by
The Secretary Of Housing & Urban Develop
Bought by
Kadlec Valeria S and Gustafson Carl
Current Estimated Value
Purchase Details
Closed on
Sep 22, 2010
Sold by
Goss Charles E and Goss Jennifer
Bought by
Gmac Mortgage Llc
Purchase Details
Closed on
Sep 20, 2010
Sold by
Gmac Mortgage Llc
Bought by
The Secretary Of Housing & Urban Develop
Purchase Details
Closed on
Aug 13, 2008
Sold by
Mitchell Urskin and Mitchell Wanda
Bought by
Goss Charles E
Home Financials for this Owner
Home Financials are based on the most recent Mortgage that was taken out on this home.
Original Mortgage
$102,718
Interest Rate
6.42%
Mortgage Type
Purchase Money Mortgage
Create a Home Valuation Report for This Property
The Home Valuation Report is an in-depth analysis detailing your home's value as well as a comparison with similar homes in the area
Home Values in the Area
Average Home Value in this Area
Purchase History
| Date | Buyer | Sale Price | Title Company |
|---|---|---|---|
| Kadlec Valeria S | -- | None Available | |
| Gmac Mortgage Llc | $106,907 | None Available | |
| The Secretary Of Housing & Urban Develop | -- | Lsi Title Agency Inc | |
| Goss Charles E | -- | Stewart Title Houston Div |
Source: Public Records
Mortgage History
| Date | Status | Borrower | Loan Amount |
|---|---|---|---|
| Previous Owner | Goss Charles E | $102,718 |
Source: Public Records
Tax History Compared to Growth
Tax History
| Year | Tax Paid | Tax Assessment Tax Assessment Total Assessment is a certain percentage of the fair market value that is determined by local assessors to be the total taxable value of land and additions on the property. | Land | Improvement |
|---|---|---|---|---|
| 2025 | $109 | $120,835 | -- | -- |
| 2024 | $109 | $109,850 | -- | -- |
| 2023 | $109 | $99,864 | $0 | $0 |
| 2022 | $657 | $90,785 | -- | -- |
| 2021 | $1,719 | $133,760 | $40,020 | $93,740 |
| 2020 | $1,600 | $130,730 | $40,020 | $90,710 |
| 2019 | $1,519 | $102,470 | $37,950 | $64,520 |
| 2018 | $1,337 | $68,380 | $37,950 | $30,430 |
| 2017 | $1,225 | $56,370 | $25,880 | $30,490 |
| 2016 | $1,188 | $54,680 | $24,150 | $30,530 |
| 2015 | -- | $51,290 | $20,700 | $30,590 |
| 2014 | -- | $47,550 | $16,910 | $30,640 |
Source: Public Records
Map
Nearby Homes
- 149 Cedar Ct
- 114 Oak Hills Ct
- 126 Oak Hills Ct
- 26077 Forestcrest Ct
- 378 Ridgewood Dr
- 169 Woodway Dr
- 290 Greenbriar Dr
- 27896 Rice Rd
- 16302 Bermuda Field St
- 16206 Rustic Prairie Dr
- 16106 Rustic Prairie Dr
- 17411 Lavender Blossom Ln
- 29030 Bison Haven Dr
- 29026 Bison Haven Dr
- 29022 Bison Haven Dr
- 16222 Rustic Prairie Dr
- 16103 Rustic Prairie Dr
- 16111 Rustic Prairie Dr
- 16114 Rustic Prairie Dr
- 28947 Rustic Robin Ln