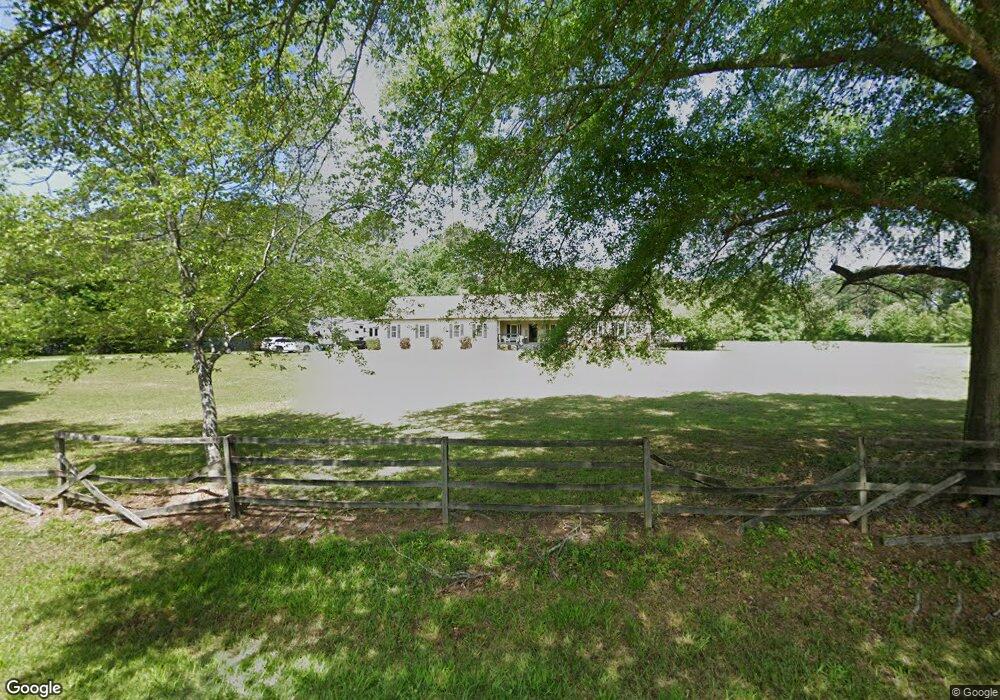
125 Crabapple Rd Unit 14C Fayetteville, GA 30215
Estimated Value: $499,000 - $610,268
3
Beds
2
Baths
2,280
Sq Ft
$234/Sq Ft
Est. Value
About This Home
This home is located at 125 Crabapple Rd Unit 14C, Fayetteville, GA 30215 and is currently estimated at $533,067, approximately $233 per square foot. 125 Crabapple Rd Unit 14C is a home located in Fayette County with nearby schools including Inman Elementary School, Whitewater Middle School, and Whitewater High School.
Ownership History
Date
Name
Owned For
Owner Type
Purchase Details
Closed on
Aug 5, 2020
Sold by
Kobie Victor D
Bought by
Moore Elvin Donald
Current Estimated Value
Home Financials for this Owner
Home Financials are based on the most recent Mortgage that was taken out on this home.
Original Mortgage
$326,800
Outstanding Balance
$289,895
Interest Rate
3%
Mortgage Type
New Conventional
Estimated Equity
$243,172
Purchase Details
Closed on
Oct 31, 2014
Sold by
Smcc Homes1 Llc
Bought by
Kobie Victor D and Kobie Amy L
Home Financials for this Owner
Home Financials are based on the most recent Mortgage that was taken out on this home.
Original Mortgage
$198,450
Interest Rate
4.26%
Mortgage Type
VA
Purchase Details
Closed on
Mar 24, 2014
Sold by
Secretary Of Housing And U
Bought by
Smcc Homes 1 Llc
Purchase Details
Closed on
May 7, 2013
Sold by
Branch Banking And Trust C
Bought by
Secretary Of Housing And Urban
Create a Home Valuation Report for This Property
The Home Valuation Report is an in-depth analysis detailing your home's value as well as a comparison with similar homes in the area
Home Values in the Area
Average Home Value in this Area
Purchase History
| Date | Buyer | Sale Price | Title Company |
|---|---|---|---|
| Moore Elvin Donald | $344,000 | -- | |
| Kobie Victor D | $245,000 | -- | |
| Smcc Homes 1 Llc | $145,000 | -- | |
| Secretary Of Housing And Urban | $289,647 | -- | |
| Branch Banking And Trust Co | $289,647 | -- |
Source: Public Records
Mortgage History
| Date | Status | Borrower | Loan Amount |
|---|---|---|---|
| Open | Moore Elvin Donald | $326,800 | |
| Previous Owner | Kobie Victor D | $198,450 |
Source: Public Records
Tax History Compared to Growth
Tax History
| Year | Tax Paid | Tax Assessment Tax Assessment Total Assessment is a certain percentage of the fair market value that is determined by local assessors to be the total taxable value of land and additions on the property. | Land | Improvement |
|---|---|---|---|---|
| 2024 | $5,419 | $199,652 | $59,624 | $140,028 |
| 2023 | $5,181 | $185,956 | $52,396 | $133,560 |
| 2022 | $4,720 | $169,696 | $46,976 | $122,720 |
| 2021 | $3,881 | $137,600 | $38,880 | $98,720 |
| 2020 | $3,899 | $140,324 | $37,324 | $103,000 |
| 2019 | $3,536 | $126,204 | $37,324 | $88,880 |
| 2018 | $3,243 | $114,676 | $32,236 | $82,440 |
| 2017 | $3,051 | $107,620 | $30,540 | $77,080 |
| 2016 | $2,849 | $98,540 | $30,540 | $68,000 |
| 2015 | $2,722 | $92,620 | $30,540 | $62,080 |
| 2014 | $2,613 | $84,580 | $30,540 | $54,040 |
| 2013 | -- | $81,084 | $0 | $0 |
Source: Public Records
Map
Nearby Homes
- 177 Lowery Rd
- 150 Goodman Dr
- 250 Lowery Rd
- 164 David Elder Rd
- 531 Grant Rd
- 155 Chantilly Ln
- 2431 Highway 92 S
- 2382 Highway 92 S
- 505 New Salem Rd
- 0 Malone Rd Unit 10548856
- 0 Malone Rd Unit 7602371
- 0 Grant Rd Unit 10544207
- 0 Grant Rd Unit 7598367
- 580 Hardy Ln
- 5092 W Mcintosh Rd
- 4251 Fayetteville Rd
- 5555 W Mcintosh Rd
- 184 Quail Rd
- 116 Woolsey Creek Trail
- 2637 Birdie Rd
- 125 Crabapple Rd
- 135 Crabapple Rd
- 125 Dogwood Cir
- 130 Crabapple Rd
- 150 Crabapple Rd
- 190 Lowery Rd Unit 14
- 190 Lowery Rd
- 120 Crabapple Rd
- 155 Crabapple Rd
- 115 Dogwood Cir
- 0 Sweetbriar Cir Unit LOT 10 7053191
- 0 Sweetbriar Cir Unit LOT 10 3096357
- LOT 8A Sweetbriar Cir
- 120 Dogwood Cir
- 200 Lowery Rd
- 100 Crabapple Rd
- 430 Crabapple Rd
- 480 Crabapple Rd
- 110 Dogwood Cir
- 440 Crabapple Rd