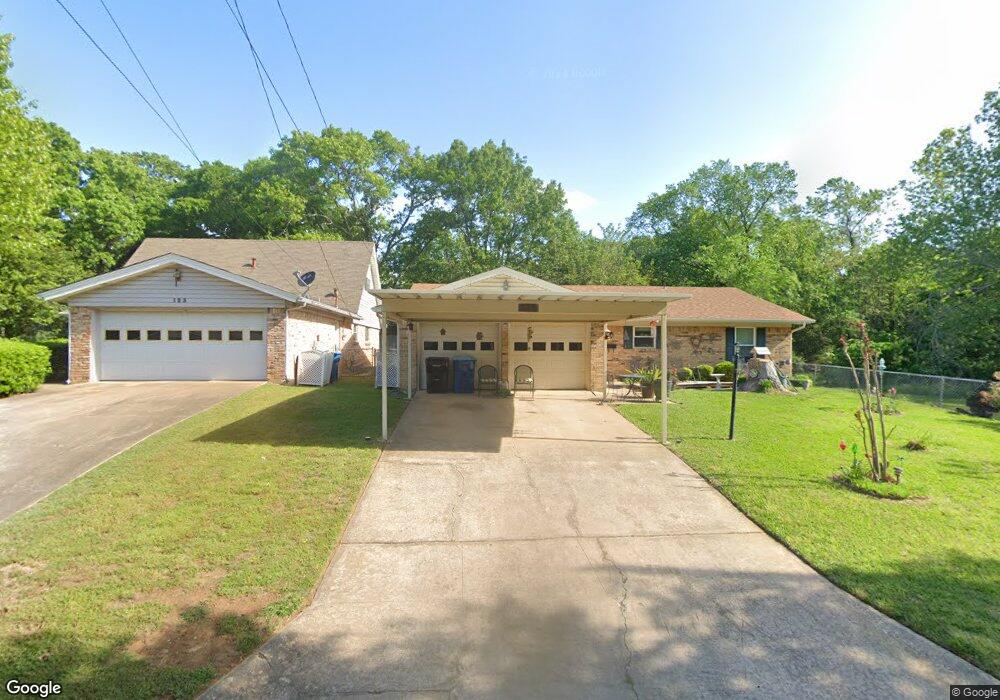
125 Doris Dr Denison, TX 75021
Estimated Value: $168,070 - $205,000
Studio
--
Bath
1,376
Sq Ft
$136/Sq Ft
Est. Value
About This Home
This home is located at 125 Doris Dr, Denison, TX 75021 and is currently estimated at $186,535, approximately $135 per square foot. 125 Doris Dr is a home located in Grayson County with nearby schools including Lamar Elementary School, Scott Middle School, and Denison High School.
Ownership History
Date
Name
Owned For
Owner Type
Purchase Details
Closed on
Mar 17, 2017
Sold by
Gibbs Timmy Lynn
Bought by
Gibbs James Lee and Gibbs Cynthia Delores
Current Estimated Value
Purchase Details
Closed on
Oct 31, 2016
Sold by
Gibbs James Lee and Gibbs Cynthia Delores
Bought by
Gibbs Timmy Lynn
Create a Home Valuation Report for This Property
The Home Valuation Report is an in-depth analysis detailing your home's value as well as a comparison with similar homes in the area
Home Values in the Area
Average Home Value in this Area
Purchase History
| Date | Buyer | Sale Price | Title Company |
|---|---|---|---|
| Gibbs James Lee | -- | None Available | |
| Gibbs Timmy Lynn | -- | None Available |
Source: Public Records
Tax History
| Year | Tax Paid | Tax Assessment Tax Assessment Total Assessment is a certain percentage of the fair market value that is determined by local assessors to be the total taxable value of land and additions on the property. | Land | Improvement |
|---|---|---|---|---|
| 2025 | $664 | $176,646 | $36,288 | $140,358 |
| 2024 | $4,154 | $178,795 | $29,952 | $148,843 |
| 2023 | $664 | $174,368 | $0 | $0 |
| 2022 | $3,766 | $158,516 | $0 | $0 |
| 2021 | $3,634 | $144,105 | $14,544 | $129,561 |
| 2020 | $3,618 | $137,158 | $14,544 | $122,614 |
| 2019 | $3,721 | $135,234 | $9,576 | $125,658 |
| 2018 | $3,425 | $129,086 | $9,576 | $119,510 |
| 2017 | $3,140 | $112,244 | $9,576 | $102,668 |
| 2016 | $2,910 | $111,213 | $9,576 | $101,637 |
Source: Public Records
Map
Nearby Homes
- 125 Mark Dr
- 153 Circle Dr
- 2526 S Fannin Ave Unit 2600
- 1905 S Lamar Ave
- 1903 S Lamar Ave
- 1917 Avenue A
- 1901 S Lamar Ave
- 501 W Collins St
- 509 W Coffin St
- 2000 S Fannin Ave
- 513 W Coffin St
- 104 E Prospect St
- 614 Rice St
- 611 W Baker St
- 618 Star St
- 701 W Star St
- 1718 S Fannin Ave
- 700 Dubois St
- 711 Dubois St
- 108 W Acheson St
Your Personal Tour Guide
Ask me questions while you tour the home.