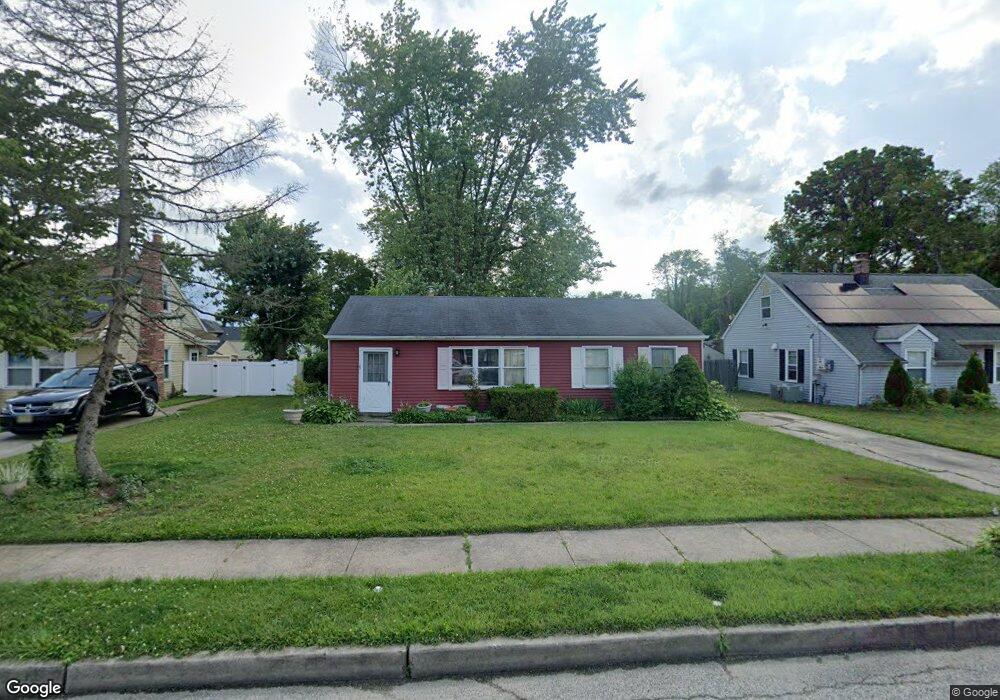
125 Dory Ct Beverly, NJ 08010
Estimated Value: $226,446 - $325,000
Studio
--
Bath
1,034
Sq Ft
$271/Sq Ft
Est. Value
About This Home
This home is located at 125 Dory Ct, Beverly, NJ 08010 and is currently estimated at $280,612, approximately $271 per square foot. 125 Dory Ct is a home located in Burlington County with nearby schools including Beverly School and Cathedral of Love Christian School.
Ownership History
Date
Name
Owned For
Owner Type
Purchase Details
Closed on
Dec 2, 2004
Sold by
Wortham Frank
Bought by
Kinniebrew Robertina
Current Estimated Value
Purchase Details
Closed on
Oct 11, 1994
Sold by
Federal National Mortgage Association
Bought by
Kinnebrew Robertina
Purchase Details
Closed on
Sep 14, 1994
Sold by
Deposit Guaranty Mtg Company
Bought by
Federal National Mortgage Association
Create a Home Valuation Report for This Property
The Home Valuation Report is an in-depth analysis detailing your home's value as well as a comparison with similar homes in the area
Home Values in the Area
Average Home Value in this Area
Purchase History
| Date | Buyer | Sale Price | Title Company |
|---|---|---|---|
| Kinniebrew Robertina | -- | -- | |
| Kinnebrew Robertina | $74,500 | -- | |
| Federal National Mortgage Association | $74,500 | -- |
Source: Public Records
Tax History Compared to Growth
Tax History
| Year | Tax Paid | Tax Assessment Tax Assessment Total Assessment is a certain percentage of the fair market value that is determined by local assessors to be the total taxable value of land and additions on the property. | Land | Improvement |
|---|---|---|---|---|
| 2025 | $6,077 | $122,700 | $48,000 | $74,700 |
| 2024 | $6,123 | $122,700 | $48,000 | $74,700 |
| 2023 | $6,123 | $122,700 | $48,000 | $74,700 |
| 2022 | $6,199 | $122,700 | $48,000 | $74,700 |
| 2021 | $6,048 | $122,700 | $48,000 | $74,700 |
| 2020 | $5,882 | $122,700 | $48,000 | $74,700 |
| 2019 | $5,730 | $122,700 | $48,000 | $74,700 |
| 2018 | $5,593 | $122,700 | $48,000 | $74,700 |
| 2017 | $5,524 | $122,700 | $48,000 | $74,700 |
| 2016 | $5,447 | $122,700 | $48,000 | $74,700 |
| 2015 | $5,385 | $122,700 | $48,000 | $74,700 |
| 2014 | $5,134 | $122,700 | $48,000 | $74,700 |
Source: Public Records
Map
Nearby Homes
- 1045 Ashton Ave
- 617 3rd St
- 400 Magnolia St
- 301 Broad St
- 530 Magnolia St
- 410 Illinois Ave
- 504 Bridge St
- 310 Front St
- 218 Cooper St
- 124 Cooper St
- 161 Warren St
- 505 Jennings St
- 5 River Ln Unit V
- 424 Jennings St
- 19 Fox Ct Unit EE19
- 636 Elizabeth St
- 740 Perkins Ln
- 44 River Ln Unit HH44
- 59 Pine St
- 50 Pine St